CHIPS WORKFLOW
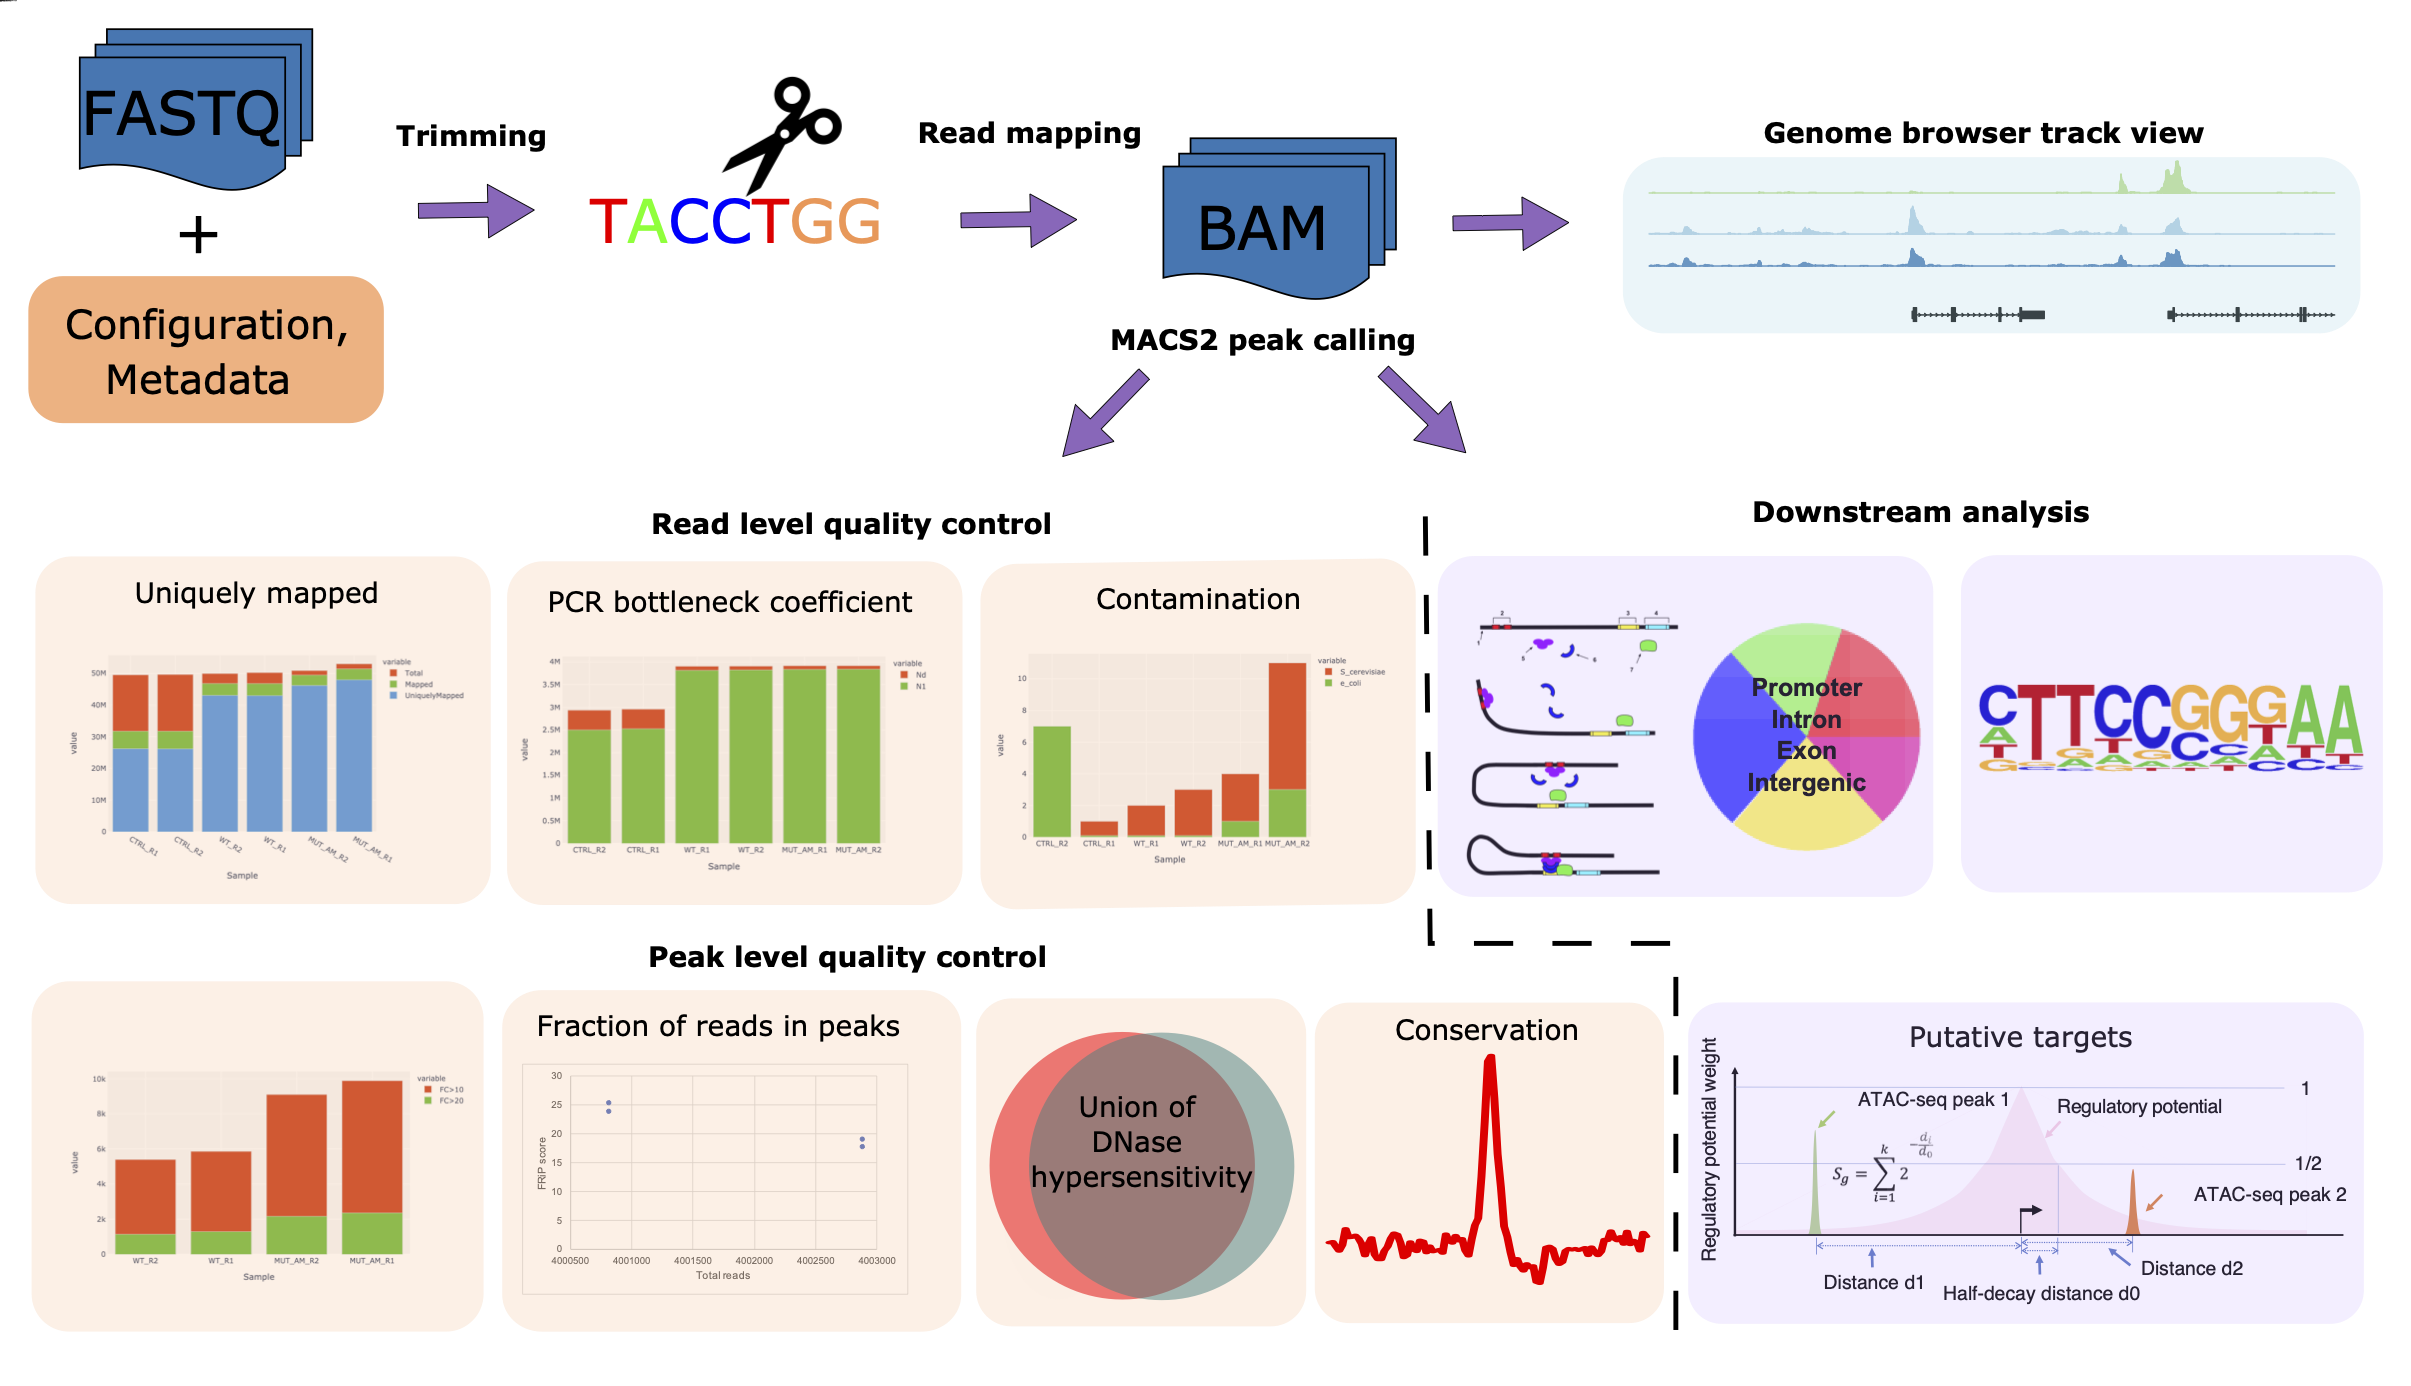
The CHIPs pipeline is designed to perform robust quality control and reproducible processing of the chromatin profile sequencing data derived from ChIP-seq, DNase-seq, and ATAC-seq. CHIPs analysis is implemented across ten main procedures: Read alignment; Quality control; Sample contamination; Copy number variation calling; Peak calling; Fraction of reads in peaks (FRIP) score and PCR bottleneck coefficient (PBC); Annotation with the cis-regulatory element annotation system (CEAS), including intersection with union DNase I hypersensitive sites (DHS); Gene target prediction; Motif enrichment; Evolutionary conservation. The inputs to the pipeline are FASTQ/BAM format DNA sequence read files. The pipeline itself is encoded in the workflow language snakemake and executed in a conda environment using the cluster engine. The workflow is shown here. For any questions contact the developers at cidc-atac@ds.dfci.harvard.edu.
SELECT SOFTWARE VERSIONS
The details of other software used in CHIPs are written to software_versions_all.txt in the directory where this report was generated.
| Name | Version | Build | Channel | |
|---|---|---|---|---|
| 0 | bedtools | 2.27.1 | he513fc3_4 | bioconda |
| 1 | bwa | 0.7.15 | 1 | bioconda |
| 2 | fastp | 0.20.1 | h8b12597_0 | bioconda |
| 3 | fastqc | 0.11.9 | 0 | bioconda |
| 4 | homer | 4.11 | pl526hc9558a2_3 | bioconda |
| 5 | macs2 | 2.2.7.1 | py36h4c5857e_1 | bioconda |
| 6 | pybedtools | 0.8.1 | py36h5202f60_2 | bioconda |
ASSEMBLY
| GDC_hg38 |
|---|
READ LEVEL SUMMARY TABLE
Abbreviations: M, million; PBC, PCR bottlneck coefficient.
| Sample | Total (M) | Mapped (M) | Uniquely Mapped (M) | PBC |
|---|---|---|---|---|
| TCGA-44-3918-01A | 159 | 159 | 144 | 0.99 |
| TCGA-44-6146-01A | 636 | 635 | 577 | 0.98 |
| TCGA-44-A47F-01A | 211 | 211 | 191 | 0.96 |
| TCGA-49-AARO-01A | 233 | 232 | 207 | 0.99 |
| TCGA-4B-A93V-01A | 129 | 129 | 116 | 0.99 |
| TCGA-73-A9RS-01A | 168 | 167 | 151 | 0.98 |
| TCGA-86-A4D0-01A | 256 | 256 | 235 | 0.98 |
| TCGA-86-A4P7-01A | 165 | 165 | 148 | 0.98 |
| TCGA-86-A4P8-01A | 190 | 190 | 171 | 0.98 |
| TCGA-91-A4BC-01A | 153 | 153 | 136 | 0.99 |
| TCGA-91-A4BD-01A | 228 | 228 | 202 | 0.99 |
| TCGA-93-A4JN-01A | 148 | 147 | 134 | 0.98 |
| TCGA-93-A4JO-01A | 158 | 157 | 140 | 0.99 |
| TCGA-93-A4JQ-01A | 126 | 125 | 110 | 0.99 |
| TCGA-L4-A4E6-01A | 179 | 179 | 166 | 0.98 |
| TCGA-L9-A8F4-01A | 215 | 215 | 193 | 0.99 |
| TCGA-MP-A4SV-01A | 152 | 152 | 138 | 0.99 |
| TCGA-MP-A4T4-01A | 192 | 191 | 170 | 0.99 |
| TCGA-MP-A4T7-01A | 127 | 127 | 115 | 0.98 |
| TCGA-MP-A4TE-01A | 185 | 185 | 168 | 0.98 |
| TCGA-MP-A4TF-01A | 145 | 144 | 131 | 0.98 |
| TCGA-NJ-A4YG-01A | 160 | 160 | 143 | 0.99 |
MAPPED READS
Mapped reads refer to the number of reads successfully mapping to the genome, while uniquely mapped reads are the subset of mapped reads mapping only to one genomic location.
PCR BOTTLENECK COEFFICIENT
The PCR bottleneck coefficient (PBC) refers to the number of locations with exactly one uniquely mapped read divided by the number of unique genomic locations.
CONTAMINATION TABLE
Contamination percentages for all reference genomes are included here.
| Sample | S_cerevisiae | dm3 | e_coli | mm9 | myco_ATCC23064 | myco_ATCC23114 | myco_ATCC23714 | myco_ATCC29342 | myco_HAZ145_1 | myco_PG-8A | myco_R | myco_SK76 | myco_WVU1853 | myco_m64 |
|---|---|---|---|---|---|---|---|---|---|---|---|---|---|---|
| TCGA-44-3918-01A | 0.4 | 5.0 | 0.0 | 6.7 | 0.0 | 0.0 | 0.0 | 0.0 | 0.0 | 0.0 | 0.0 | 0.0 | 0.0 | 0.0 |
| TCGA-44-6146-01A | 0.6 | 4.1 | 0.0 | 7.1 | 0.0 | 0.0 | 0.0 | 0.0 | 0.0 | 0.0 | 0.0 | 0.0 | 0.0 | 0.0 |
| TCGA-44-A47F-01A | 0.6 | 3.0 | 0.0 | 7.2 | 0.0 | 0.0 | 0.0 | 0.0 | 0.0 | 0.0 | 0.0 | 0.0 | 0.0 | 0.0 |
| TCGA-49-AARO-01A | 0.4 | 3.7 | 0.0 | 6.4 | 0.0 | 0.0 | 0.0 | 0.0 | 0.0 | 0.0 | 0.0 | 0.0 | 0.0 | 0.0 |
| TCGA-4B-A93V-01A | 0.4 | 4.3 | 0.0 | 6.4 | 0.0 | 0.0 | 0.0 | 0.0 | 0.0 | 0.0 | 0.0 | 0.0 | 0.0 | 0.0 |
| TCGA-73-A9RS-01A | 0.6 | 3.4 | 0.0 | 7.0 | 0.0 | 0.0 | 0.0 | 0.0 | 0.0 | 0.0 | 0.0 | 0.0 | 0.0 | 0.0 |
| TCGA-86-A4D0-01A | 0.3 | 2.2 | 0.0 | 6.2 | 0.0 | 0.0 | 0.0 | 0.0 | 0.0 | 0.0 | 0.0 | 0.0 | 0.0 | 0.0 |
| TCGA-86-A4P7-01A | 0.5 | 3.6 | 0.0 | 7.0 | 0.0 | 0.0 | 0.0 | 0.0 | 0.0 | 0.0 | 0.0 | 0.0 | 0.0 | 0.0 |
| TCGA-86-A4P8-01A | 0.4 | 3.2 | 0.0 | 6.1 | 0.0 | 0.0 | 0.0 | 0.0 | 0.0 | 0.0 | 0.0 | 0.0 | 0.0 | 0.0 |
| TCGA-91-A4BC-01A | 0.4 | 3.8 | 0.0 | 6.4 | 0.0 | 0.0 | 0.0 | 0.0 | 0.0 | 0.0 | 0.0 | 0.0 | 0.0 | 0.0 |
| TCGA-91-A4BD-01A | 0.5 | 3.9 | 0.0 | 6.4 | 0.0 | 0.0 | 0.0 | 0.0 | 0.0 | 0.0 | 0.0 | 0.0 | 0.0 | 0.0 |
| TCGA-93-A4JN-01A | 0.4 | 3.1 | 0.0 | 6.4 | 0.0 | 0.0 | 0.0 | 0.0 | 0.0 | 0.0 | 0.0 | 0.0 | 0.0 | 0.0 |
| TCGA-93-A4JO-01A | 0.4 | 3.7 | 0.0 | 6.3 | 0.0 | 0.0 | 0.0 | 0.0 | 0.0 | 0.0 | 0.0 | 0.0 | 0.0 | 0.0 |
| TCGA-93-A4JQ-01A | 0.4 | 4.1 | 0.0 | 6.3 | 0.0 | 0.0 | 0.0 | 0.0 | 0.0 | 0.0 | 0.0 | 0.0 | 0.0 | 0.0 |
| TCGA-L4-A4E6-01A | 0.3 | 3.2 | 0.0 | 6.6 | 0.0 | 0.0 | 0.0 | 0.0 | 0.0 | 0.0 | 0.0 | 0.0 | 0.0 | 0.0 |
| TCGA-L9-A8F4-01A | 0.4 | 3.7 | 0.0 | 6.6 | 0.0 | 0.0 | 0.0 | 0.0 | 0.0 | 0.0 | 0.0 | 0.0 | 0.0 | 0.0 |
| TCGA-MP-A4SV-01A | 0.4 | 3.9 | 0.0 | 6.3 | 0.0 | 0.0 | 0.0 | 0.0 | 0.0 | 0.0 | 0.0 | 0.0 | 0.0 | 0.0 |
| TCGA-MP-A4T4-01A | 0.4 | 4.2 | 0.0 | 6.3 | 0.0 | 0.0 | 0.0 | 0.0 | 0.0 | 0.0 | 0.0 | 0.0 | 0.0 | 0.0 |
| TCGA-MP-A4T7-01A | 0.6 | 4.2 | 0.0 | 7.2 | 0.0 | 0.0 | 0.0 | 0.0 | 0.0 | 0.0 | 0.0 | 0.0 | 0.0 | 0.0 |
| TCGA-MP-A4TE-01A | 0.5 | 3.2 | 0.0 | 6.6 | 0.0 | 0.0 | 0.0 | 0.0 | 0.0 | 0.0 | 0.0 | 0.0 | 0.0 | 0.0 |
| TCGA-MP-A4TF-01A | 0.6 | 4.1 | 0.0 | 6.9 | 0.0 | 0.0 | 0.0 | 0.0 | 0.0 | 0.0 | 0.0 | 0.0 | 0.0 | 0.0 |
| TCGA-NJ-A4YG-01A | 0.4 | 3.6 | 0.0 | 5.9 | 0.0 | 0.0 | 0.0 | 0.0 | 0.0 | 0.0 | 0.0 | 0.0 | 0.0 | 0.0 |
CONTAMINATION
The reported values for each species represent the percent of 100,000 reads that map to the reference genome of that species.
FRAGMENT LENGTH
Fragment size distributions show paired-end fragments in each sample. The plotted value for each sample is the probability density in a 5 bp bin size normalized so the integral is 1.
PEAK LEVEL SUMMARY TABLE
Abbreviations: 10FC, > 10 fold change; 20FC, > 20 fold change; FRiP, Fraction of reads in peaks; Prom, Promoter; Inter, Intergenic; DHS, DNAseI hypersensitivity sites
| Run | Total | 10FC | 20FC | FRiP | % prom | % exons | % introns | % inter | % DHS |
|---|---|---|---|---|---|---|---|---|---|
| TCGA-44-3918-01A.rep1 | 53453 | 602 | 4 | 11.1 | 17.35 | 6.92 | 36.19 | 39.54 | 92.38 |
| TCGA-86-A4P8-01A.rep1 | 100603 | 5394 | 6 | 30.0 | 11.75 | 4.48 | 41.86 | 41.91 | 96.22 |
| TCGA-73-A9RS-01A.rep1 | 90492 | 1252 | 4 | 30.3 | 11.68 | 5.41 | 42.65 | 40.26 | 97.22 |
| TCGA-MP-A4SV-01A.rep1 | 57910 | 427 | 3 | 11.1 | 16.62 | 6.31 | 37.36 | 39.72 | 94.18 |
| TCGA-4B-A93V-01A.rep1 | 60654 | 337 | 7 | 12.0 | 15.46 | 5.65 | 39.55 | 39.35 | 91.8 |
| TCGA-93-A4JN-01A.rep1 | 101557 | 5719 | 8 | 34.4 | 11.44 | 4.69 | 41.8 | 42.06 | 96.66 |
| TCGA-L4-A4E6-01A.rep1 | 81002 | 3104 | 4 | 24.5 | 13.35 | 5.02 | 38.92 | 42.72 | 95.5 |
| TCGA-91-A4BD-01A.rep1 | 77578 | 1184 | 7 | 19.1 | 13.88 | 5.53 | 39.22 | 41.37 | 92.18 |
| TCGA-91-A4BC-01A.rep1 | 101002 | 1396 | 5 | 21.1 | 12.11 | 4.5 | 42.35 | 41.03 | 96.4 |
| TCGA-49-AARO-01A.rep1 | 61963 | 373 | 1 | 11.8 | 15.9 | 5.81 | 37.78 | 40.51 | 94.5 |
| TCGA-93-A4JQ-01A.rep1 | 36483 | 266 | 5 | 6.7 | 23.81 | 7.58 | 33.32 | 35.29 | 93.96 |
| TCGA-MP-A4T4-01A.rep1 | 56013 | 136 | 1 | 9.9 | 16.51 | 6.73 | 39.32 | 37.44 | 93.3 |
| TCGA-86-A4P7-01A.rep1 | 94623 | 6757 | 9 | 31.8 | 12.24 | 4.64 | 41.42 | 41.7 | 95.48 |
| TCGA-MP-A4TE-01A.rep1 | 119978 | 3594 | 3 | 35.7 | 9.96 | 4.38 | 42.26 | 43.4 | 96.16 |
| TCGA-NJ-A4YG-01A.rep1 | 77100 | 811 | 4 | 15.5 | 13.48 | 5.29 | 38.35 | 42.88 | 94.74 |
| TCGA-93-A4JO-01A.rep1 | 58578 | 373 | 2 | 14.1 | 16.73 | 7.2 | 38.84 | 37.22 | 96.9 |
| TCGA-MP-A4TF-01A.rep1 | 74701 | 1673 | 2 | 19.6 | 13.92 | 5.57 | 39.09 | 41.42 | 97.02 |
| TCGA-44-A47F-01A.rep1 | 137873 | 28362 | 245 | 60.0 | 9.25 | 3.89 | 40.8 | 46.05 | 90.28 |
| TCGA-MP-A4T7-01A.rep1 | 63156 | 1325 | 4 | 20.5 | 16.01 | 6.62 | 37.82 | 39.54 | 97.48 |
| TCGA-44-6146-01A.rep1 | 95182 | 165 | 1 | 28.4 | 10.99 | 5.33 | 42.11 | 41.57 | 96.42 |
| TCGA-86-A4D0-01A.rep1 | 124291 | 7166 | 12 | 35.9 | 9.74 | 4.14 | 42.04 | 44.08 | 91.28 |
| TCGA-L9-A8F4-01A.rep1 | 79717 | 782 | 4 | 20.7 | 14.27 | 5.81 | 40.25 | 39.67 | 97.74 |
NUMBER OF PEAKS
The total peaks called, the peaks with a > 10 fold change (10FC), and the peaks with a > 20 fold change (20FC) for each run are represented here.
FRACTION OF READS IN PEAKS
The fraction of reads in peaks (FRIP) score is the fraction of 4 million subsampled reads that fall within a defined peak region.
PEAK ANNOTATIONS
The proportions of peaks for each sample overlapping with the promoters, exons, introns, and intergenic regions are shown here.
DNASE I HYPERSENSITIVITY
DNAse hypersensitive sites (DHS) may represent highly active regions of the genome. The data below represent the percentage of 4 million subsampled peaks that intersect with DHS peaks as defined by list of known DHS regions (specific to each species).
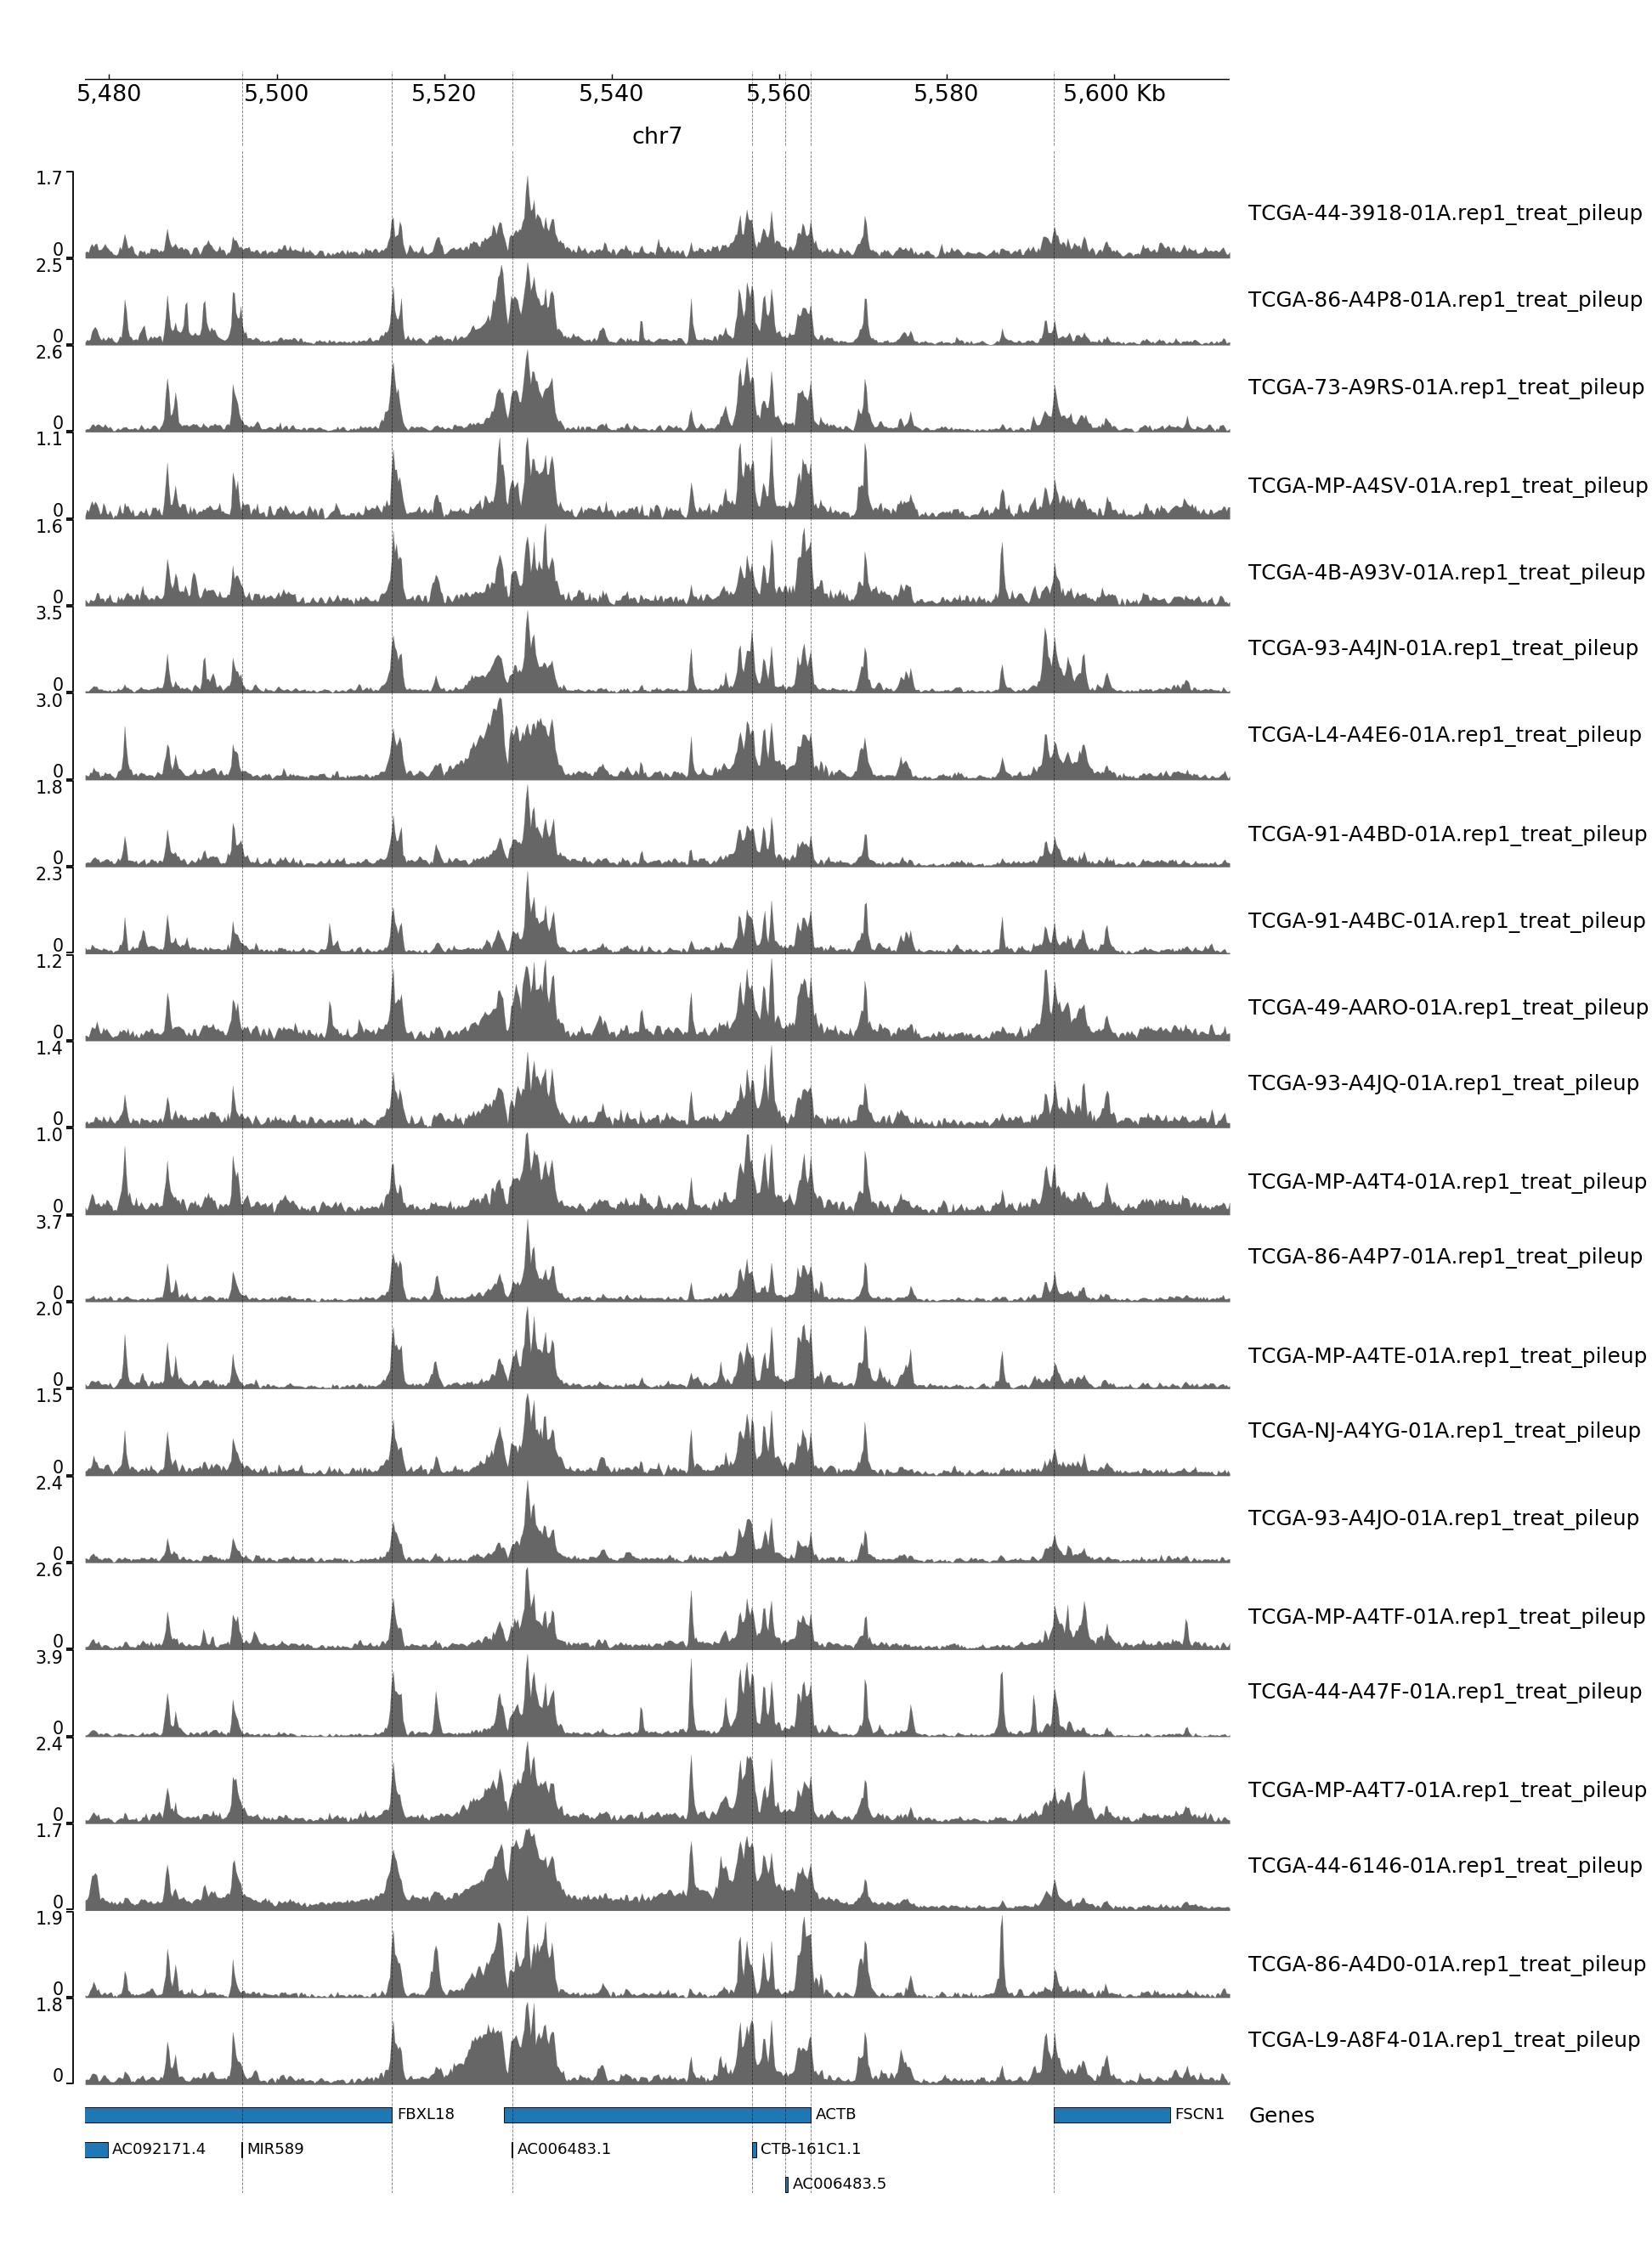
GENOME TRACK FOR ACTB
The genomic coordinates and chromosome number are indicated above the sample tracks. Transcripts in this region are indicated by the bars below the sample tracks.
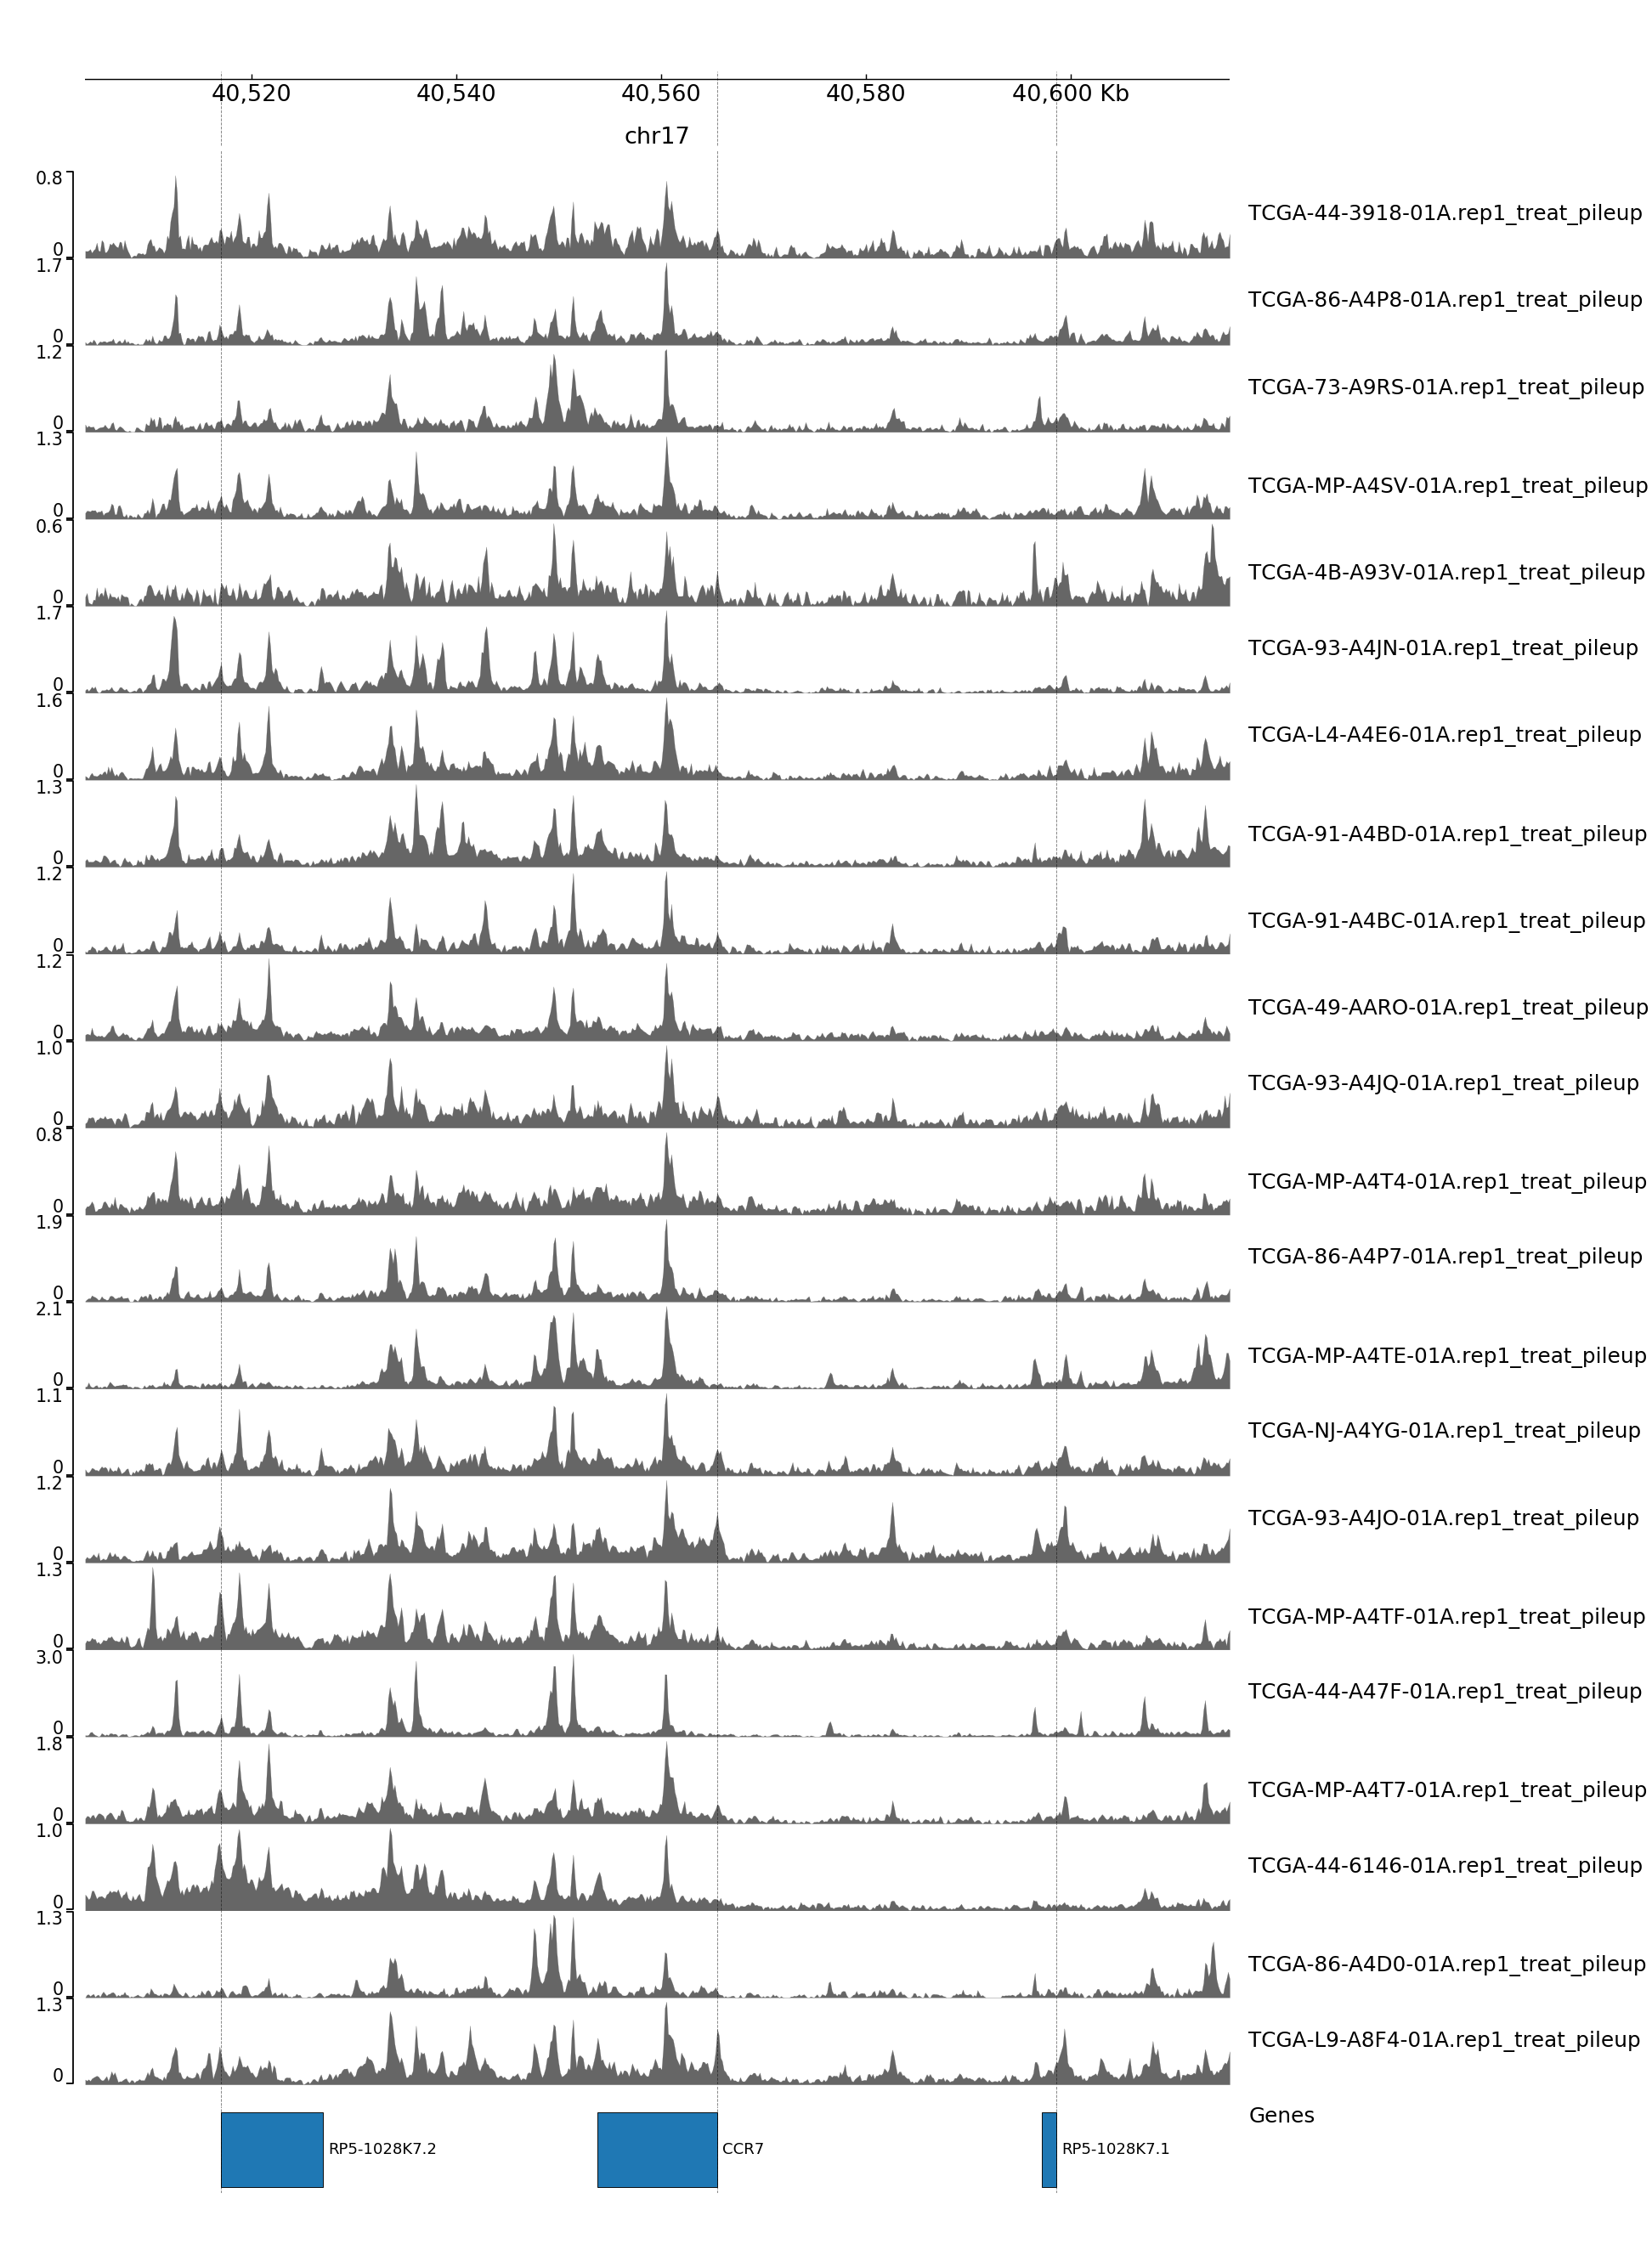
GENOME TRACK FOR CCR7
The genomic coordinates and chromosome number are indicated above the sample tracks. Transcripts in this region are indicated by the bars below the sample tracks.
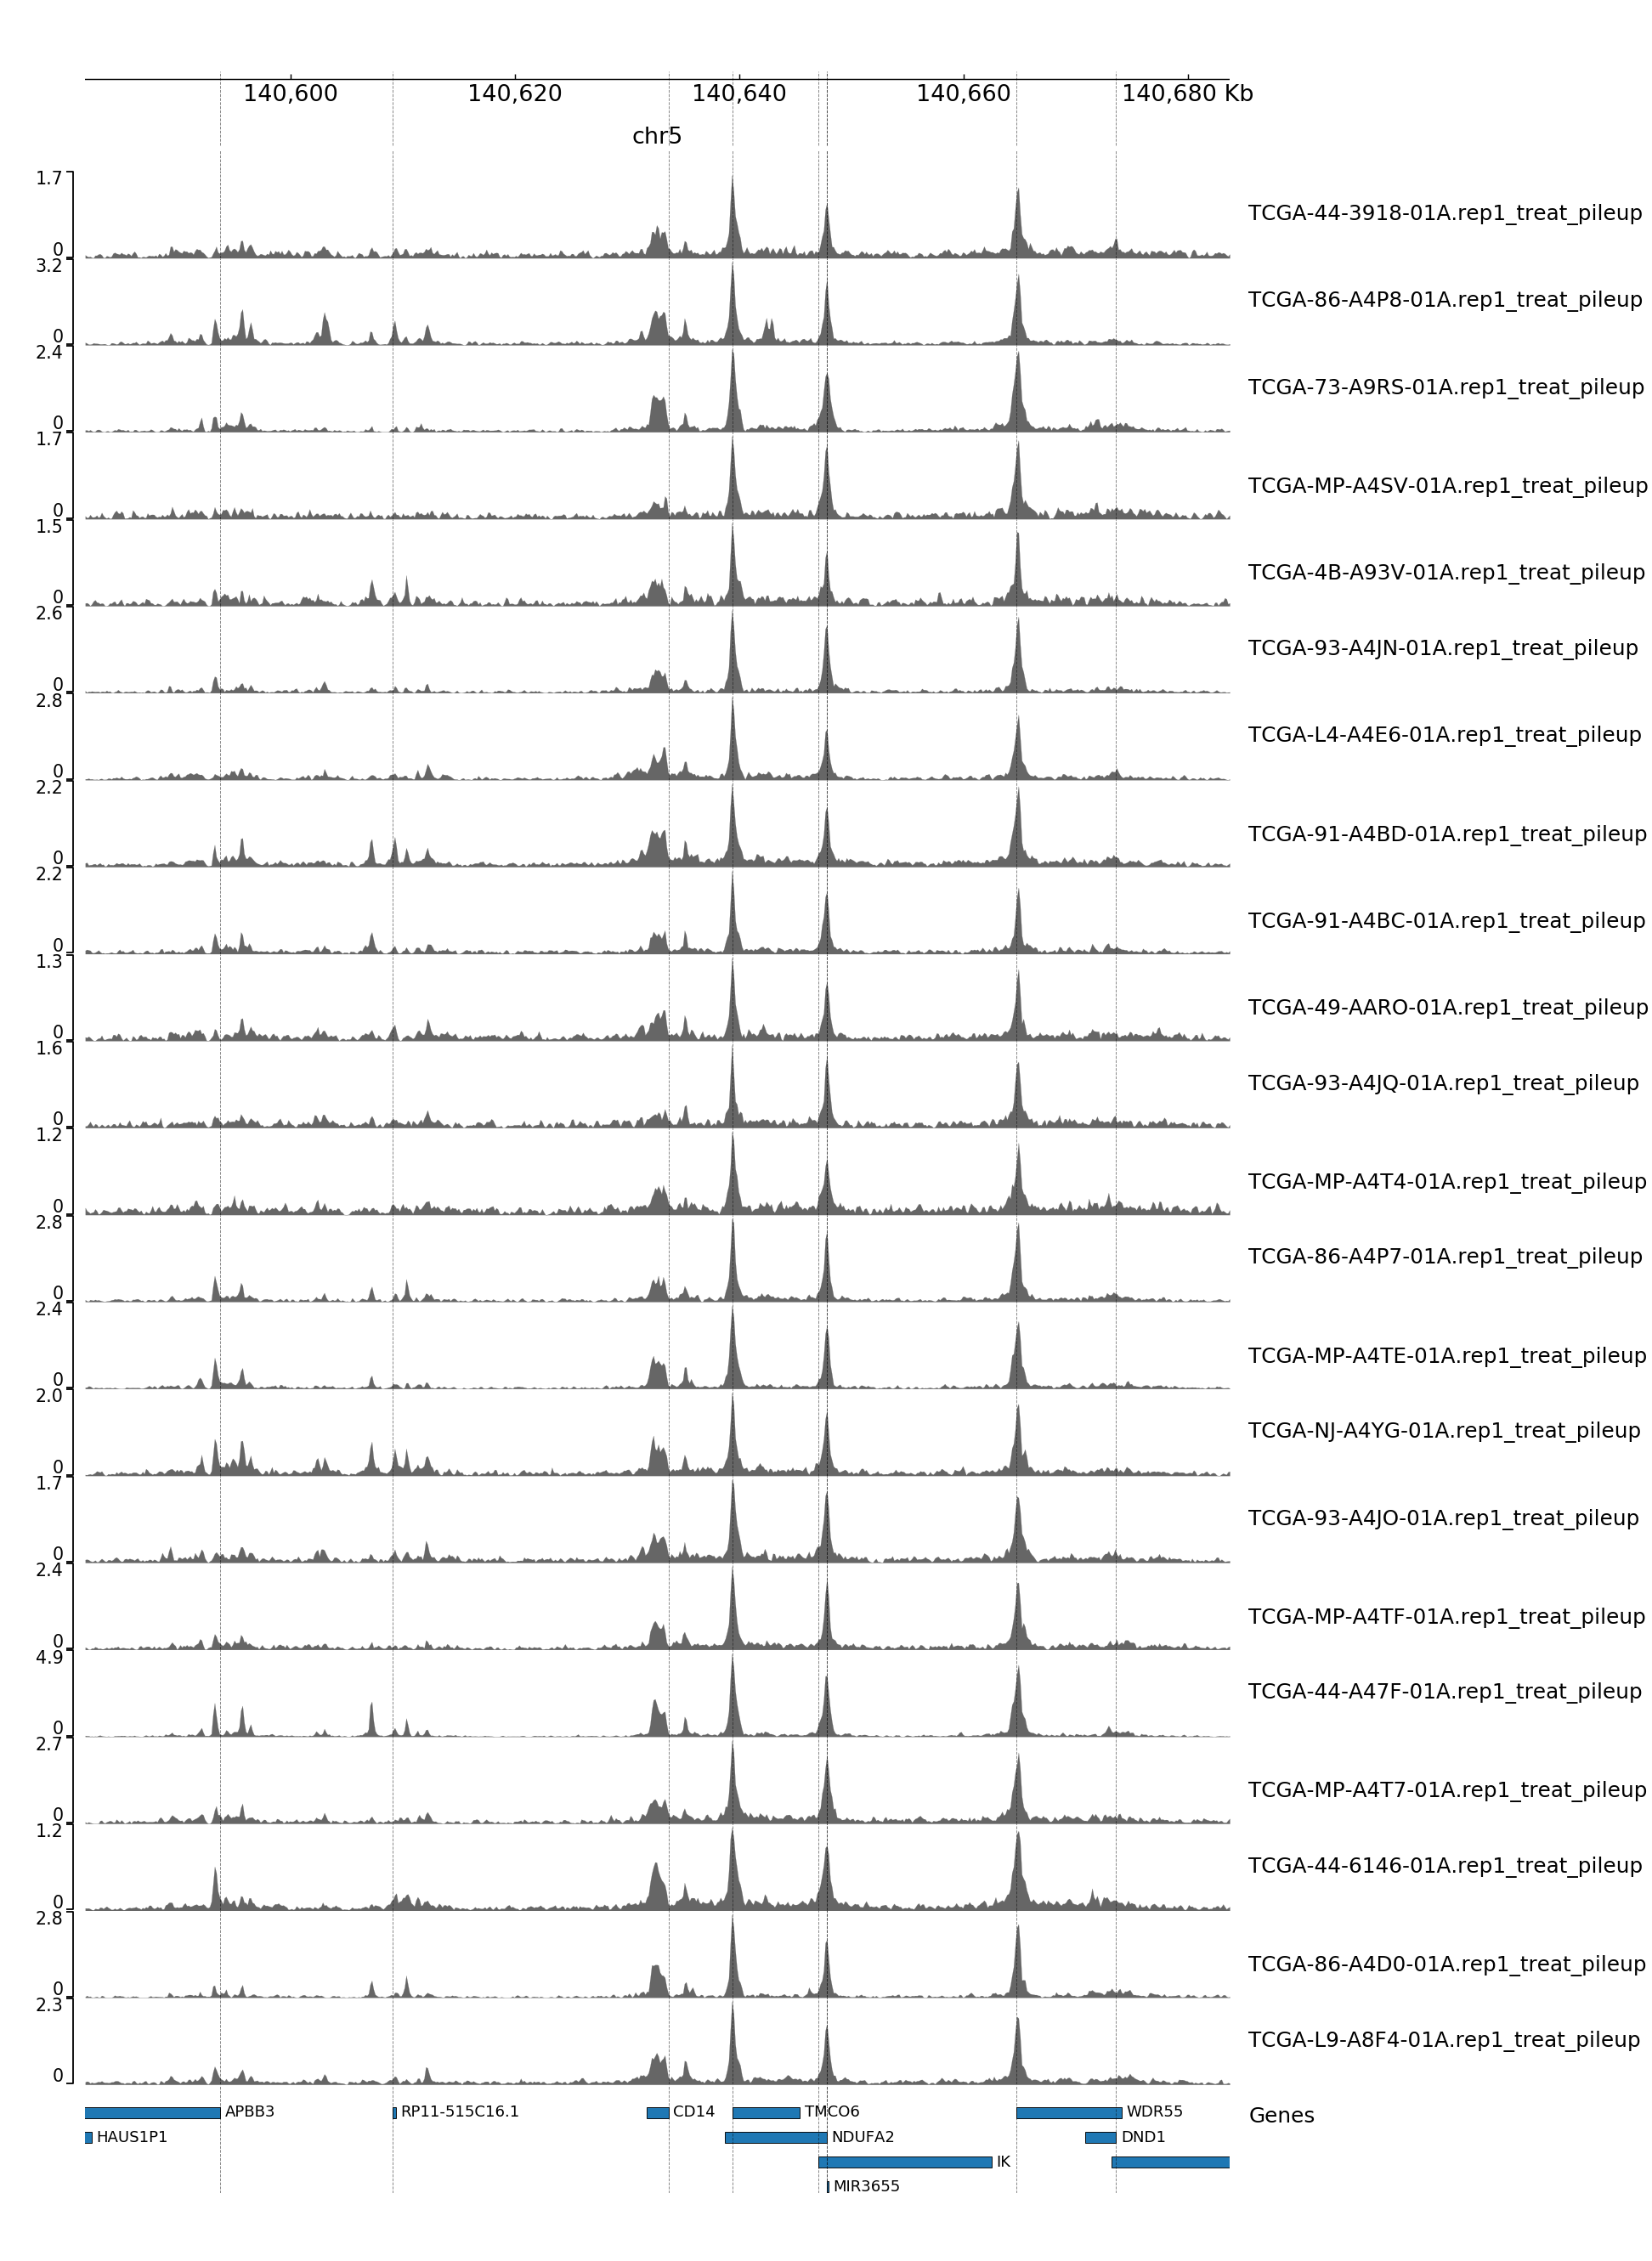
GENOME TRACK FOR CD14
The genomic coordinates and chromosome number are indicated above the sample tracks. Transcripts in this region are indicated by the bars below the sample tracks.
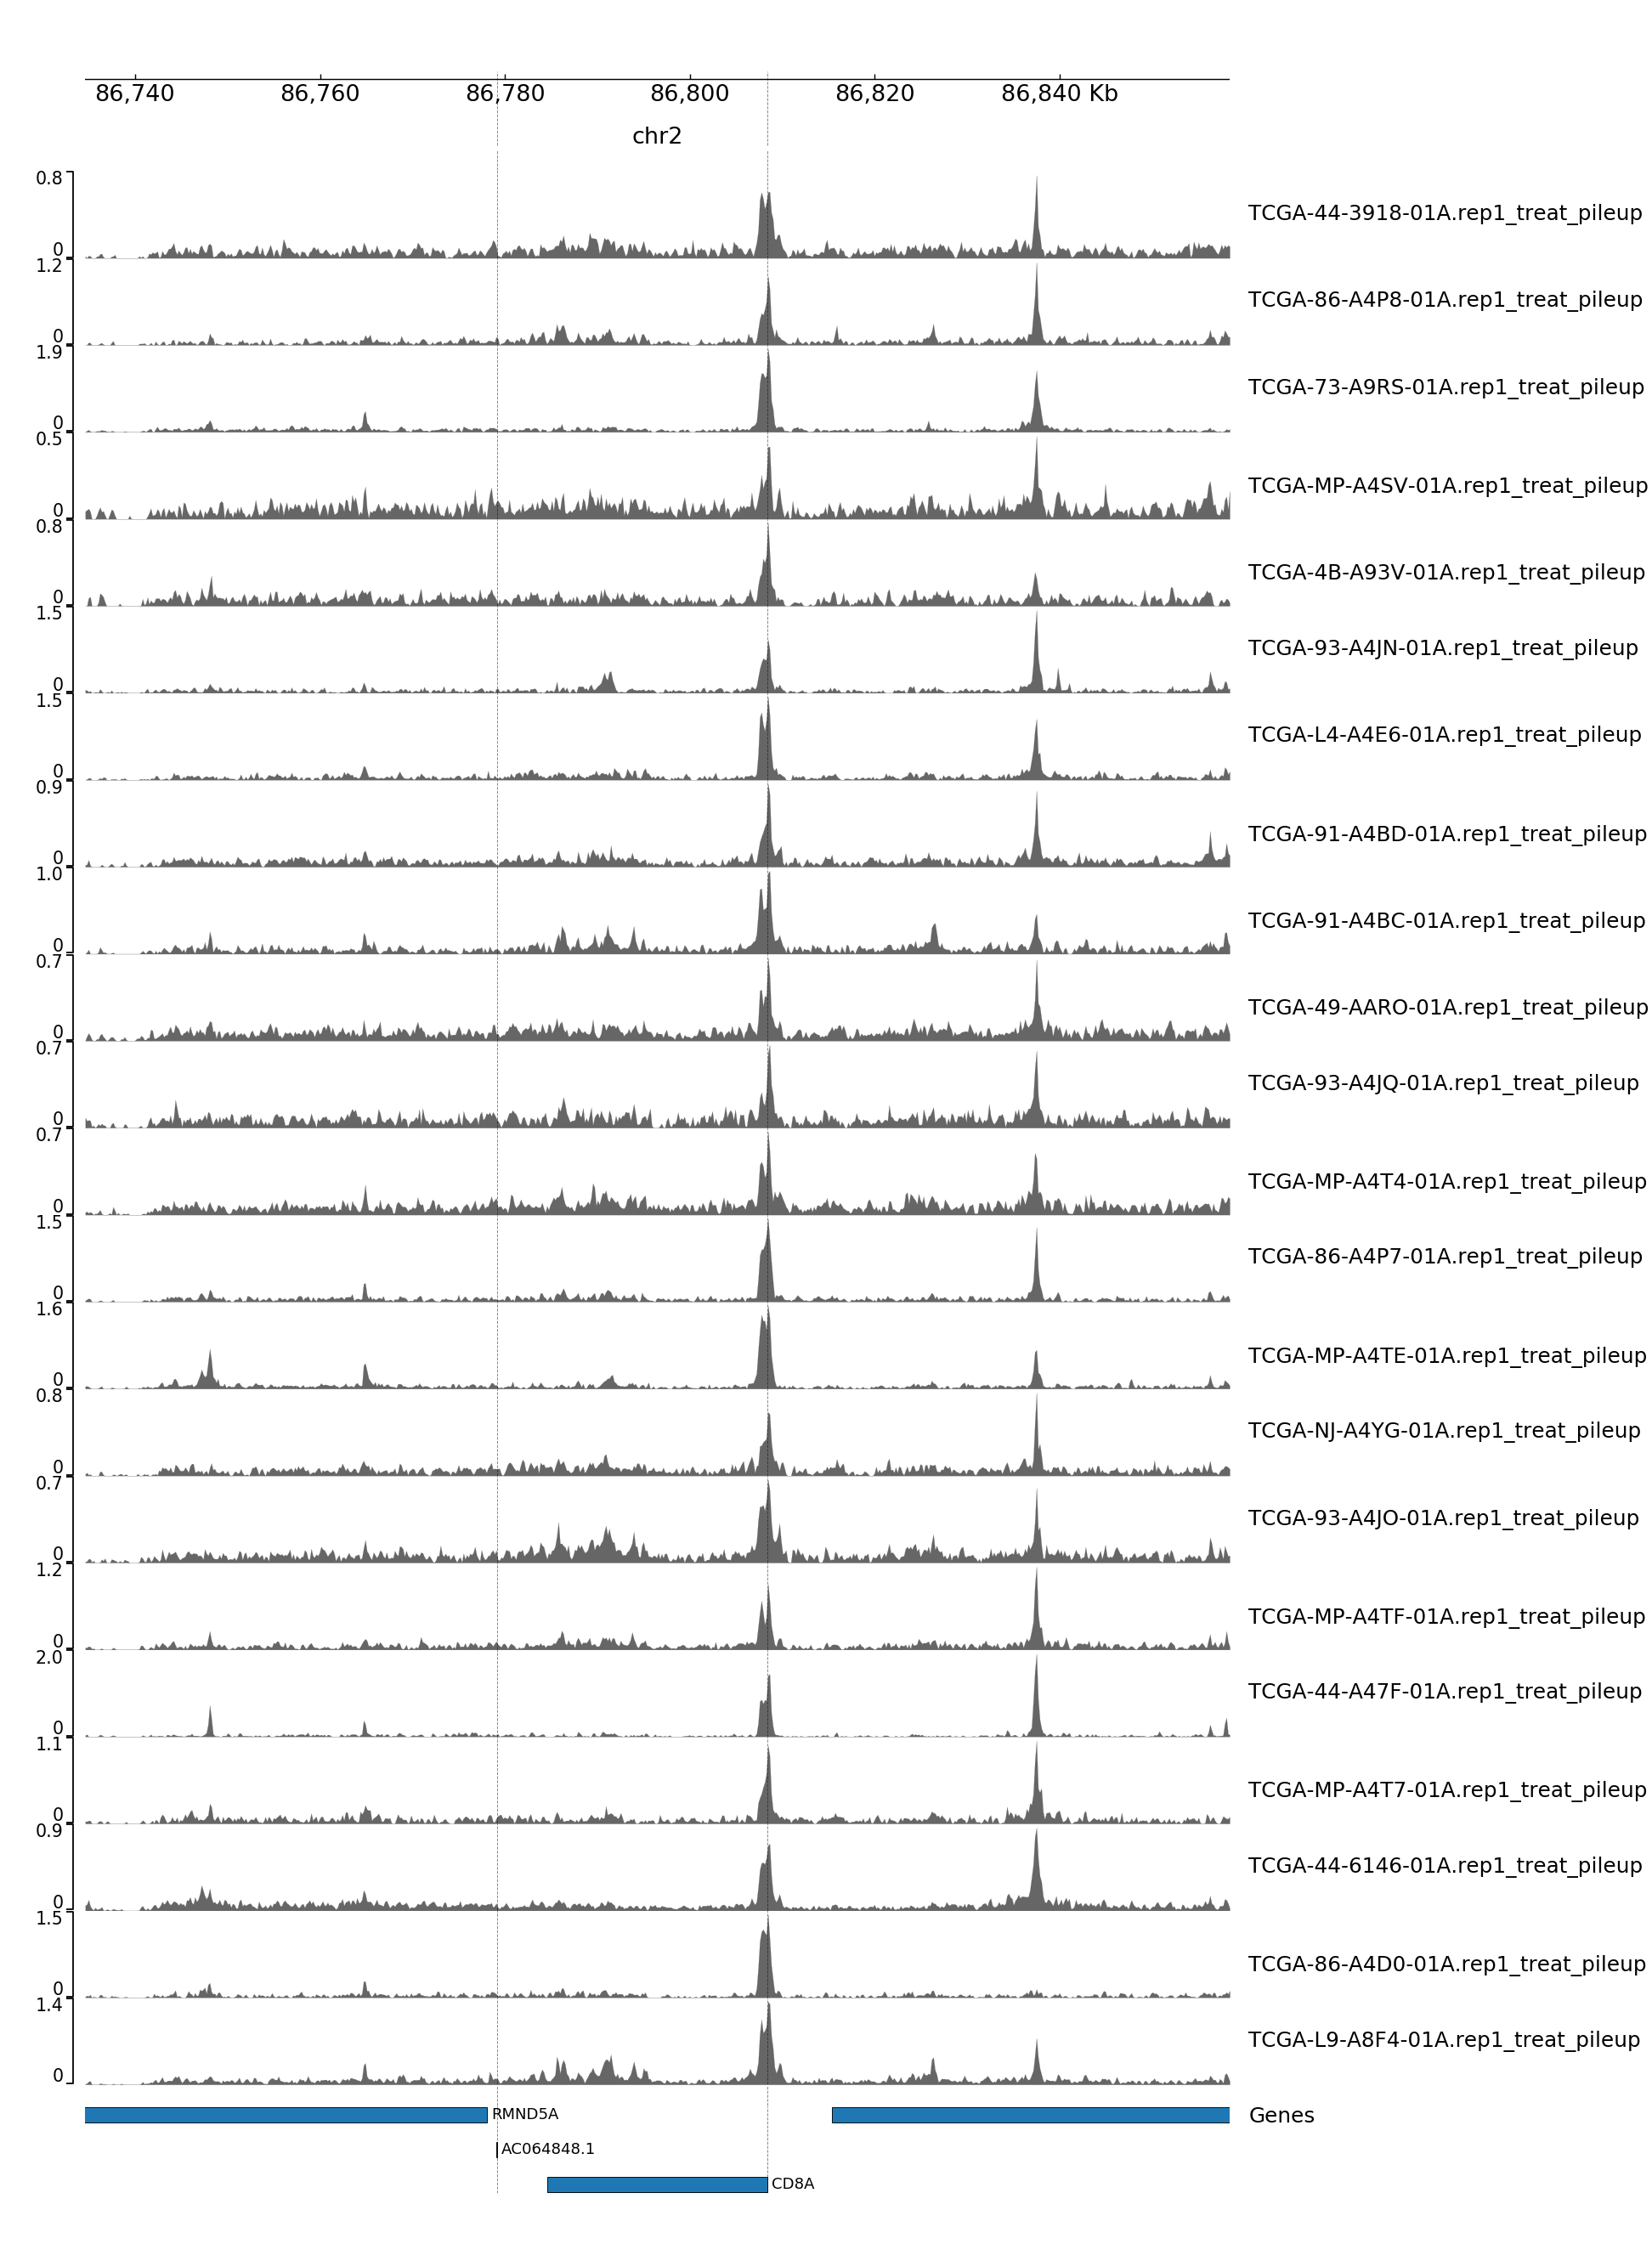
GENOME TRACK FOR CD8A
The genomic coordinates and chromosome number are indicated above the sample tracks. Transcripts in this region are indicated by the bars below the sample tracks.
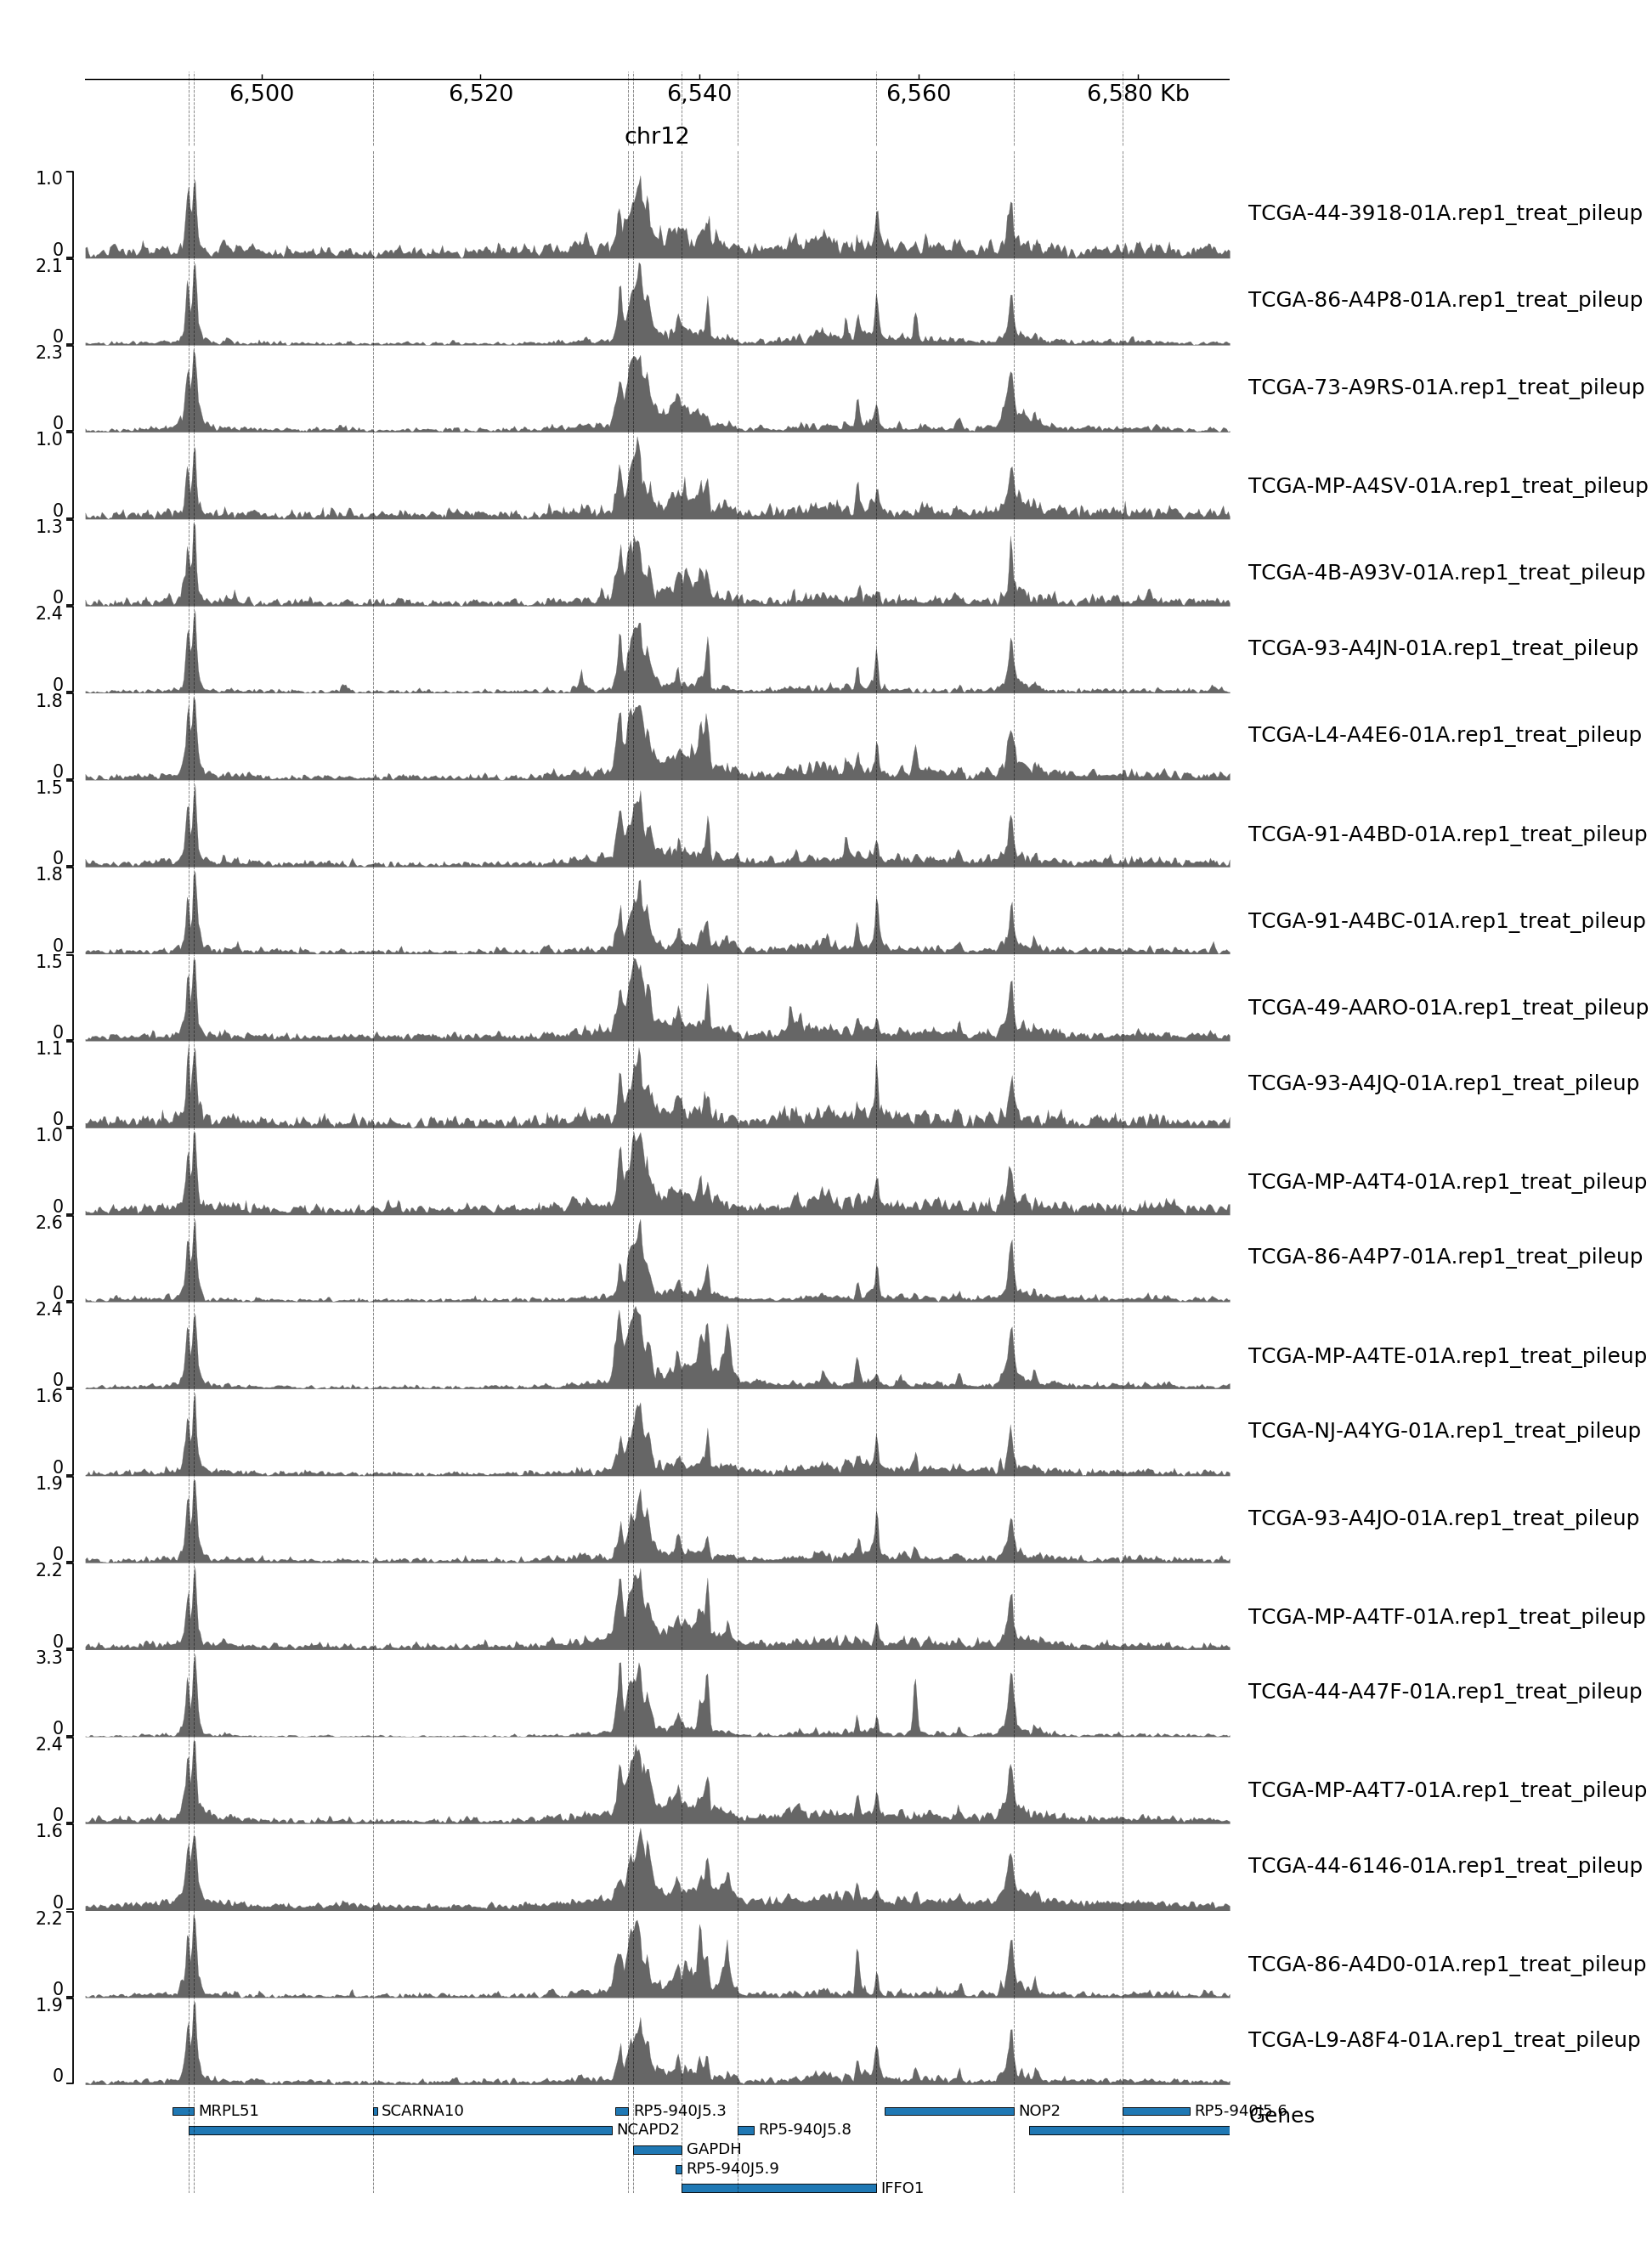
GENOME TRACK FOR GAPDH
The genomic coordinates and chromosome number are indicated above the sample tracks. Transcripts in this region are indicated by the bars below the sample tracks.
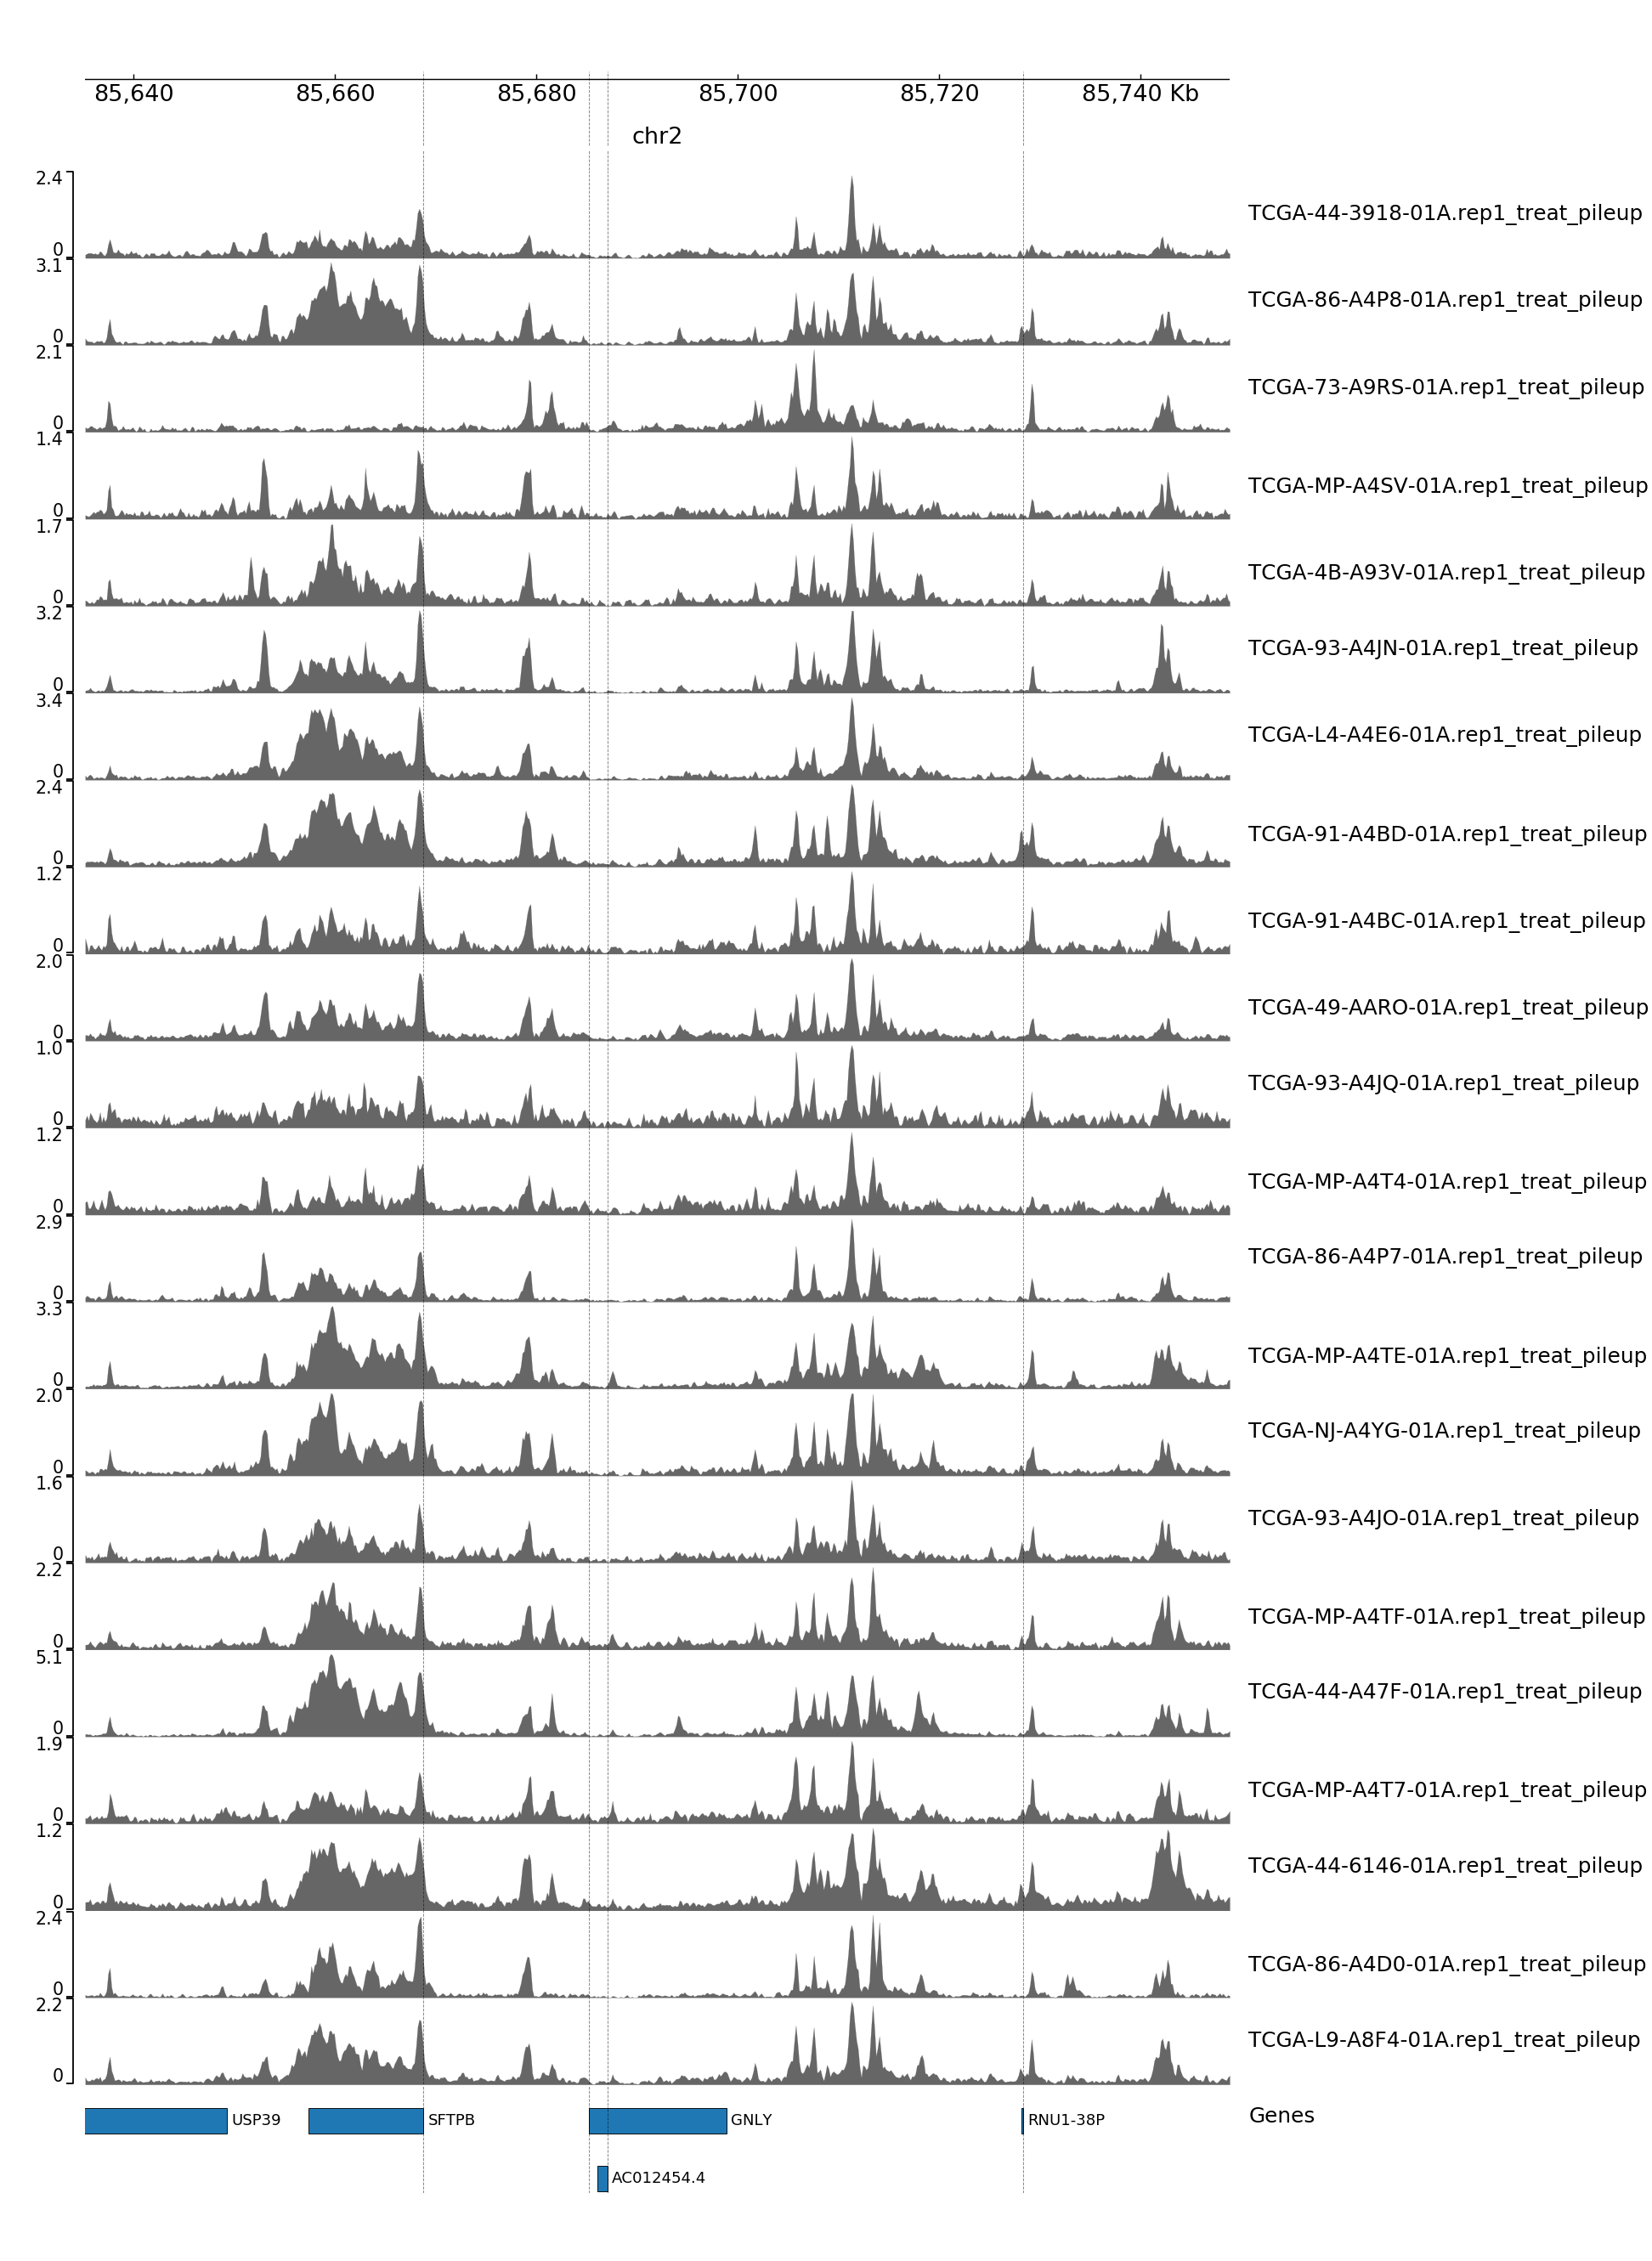
GENOME TRACK FOR GNLY
The genomic coordinates and chromosome number are indicated above the sample tracks. Transcripts in this region are indicated by the bars below the sample tracks.
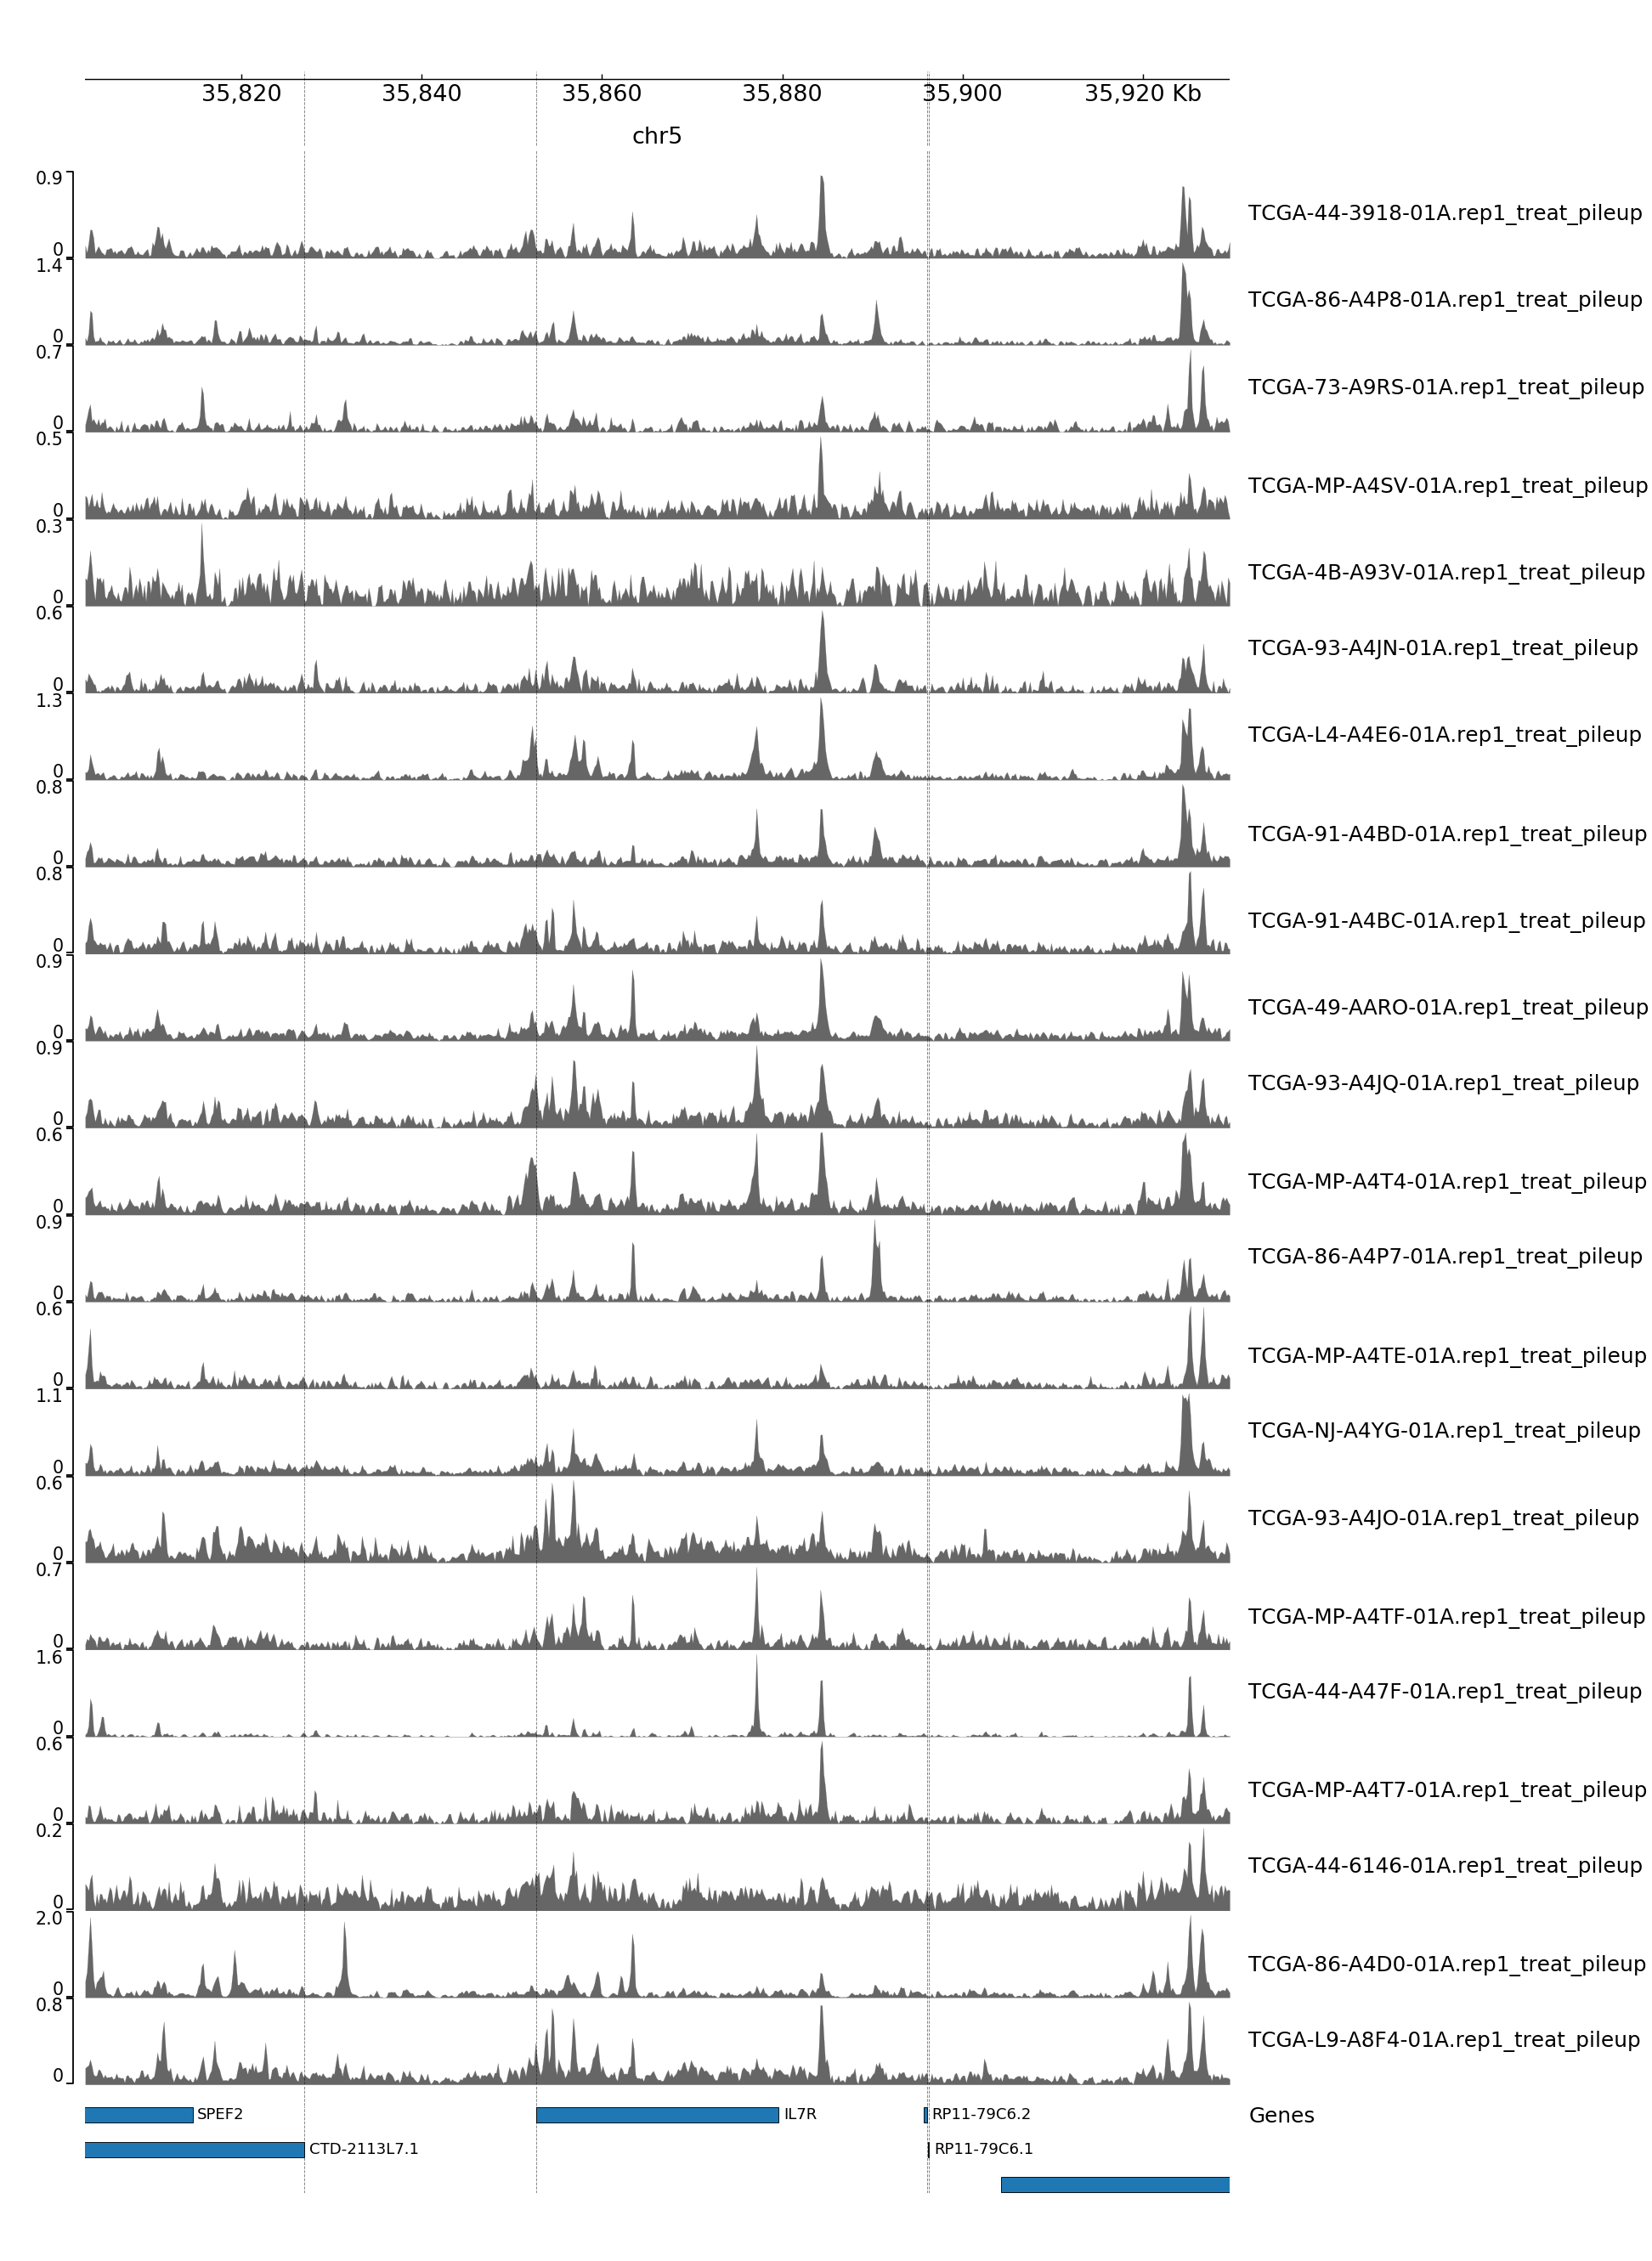
GENOME TRACK FOR IL7R
The genomic coordinates and chromosome number are indicated above the sample tracks. Transcripts in this region are indicated by the bars below the sample tracks.
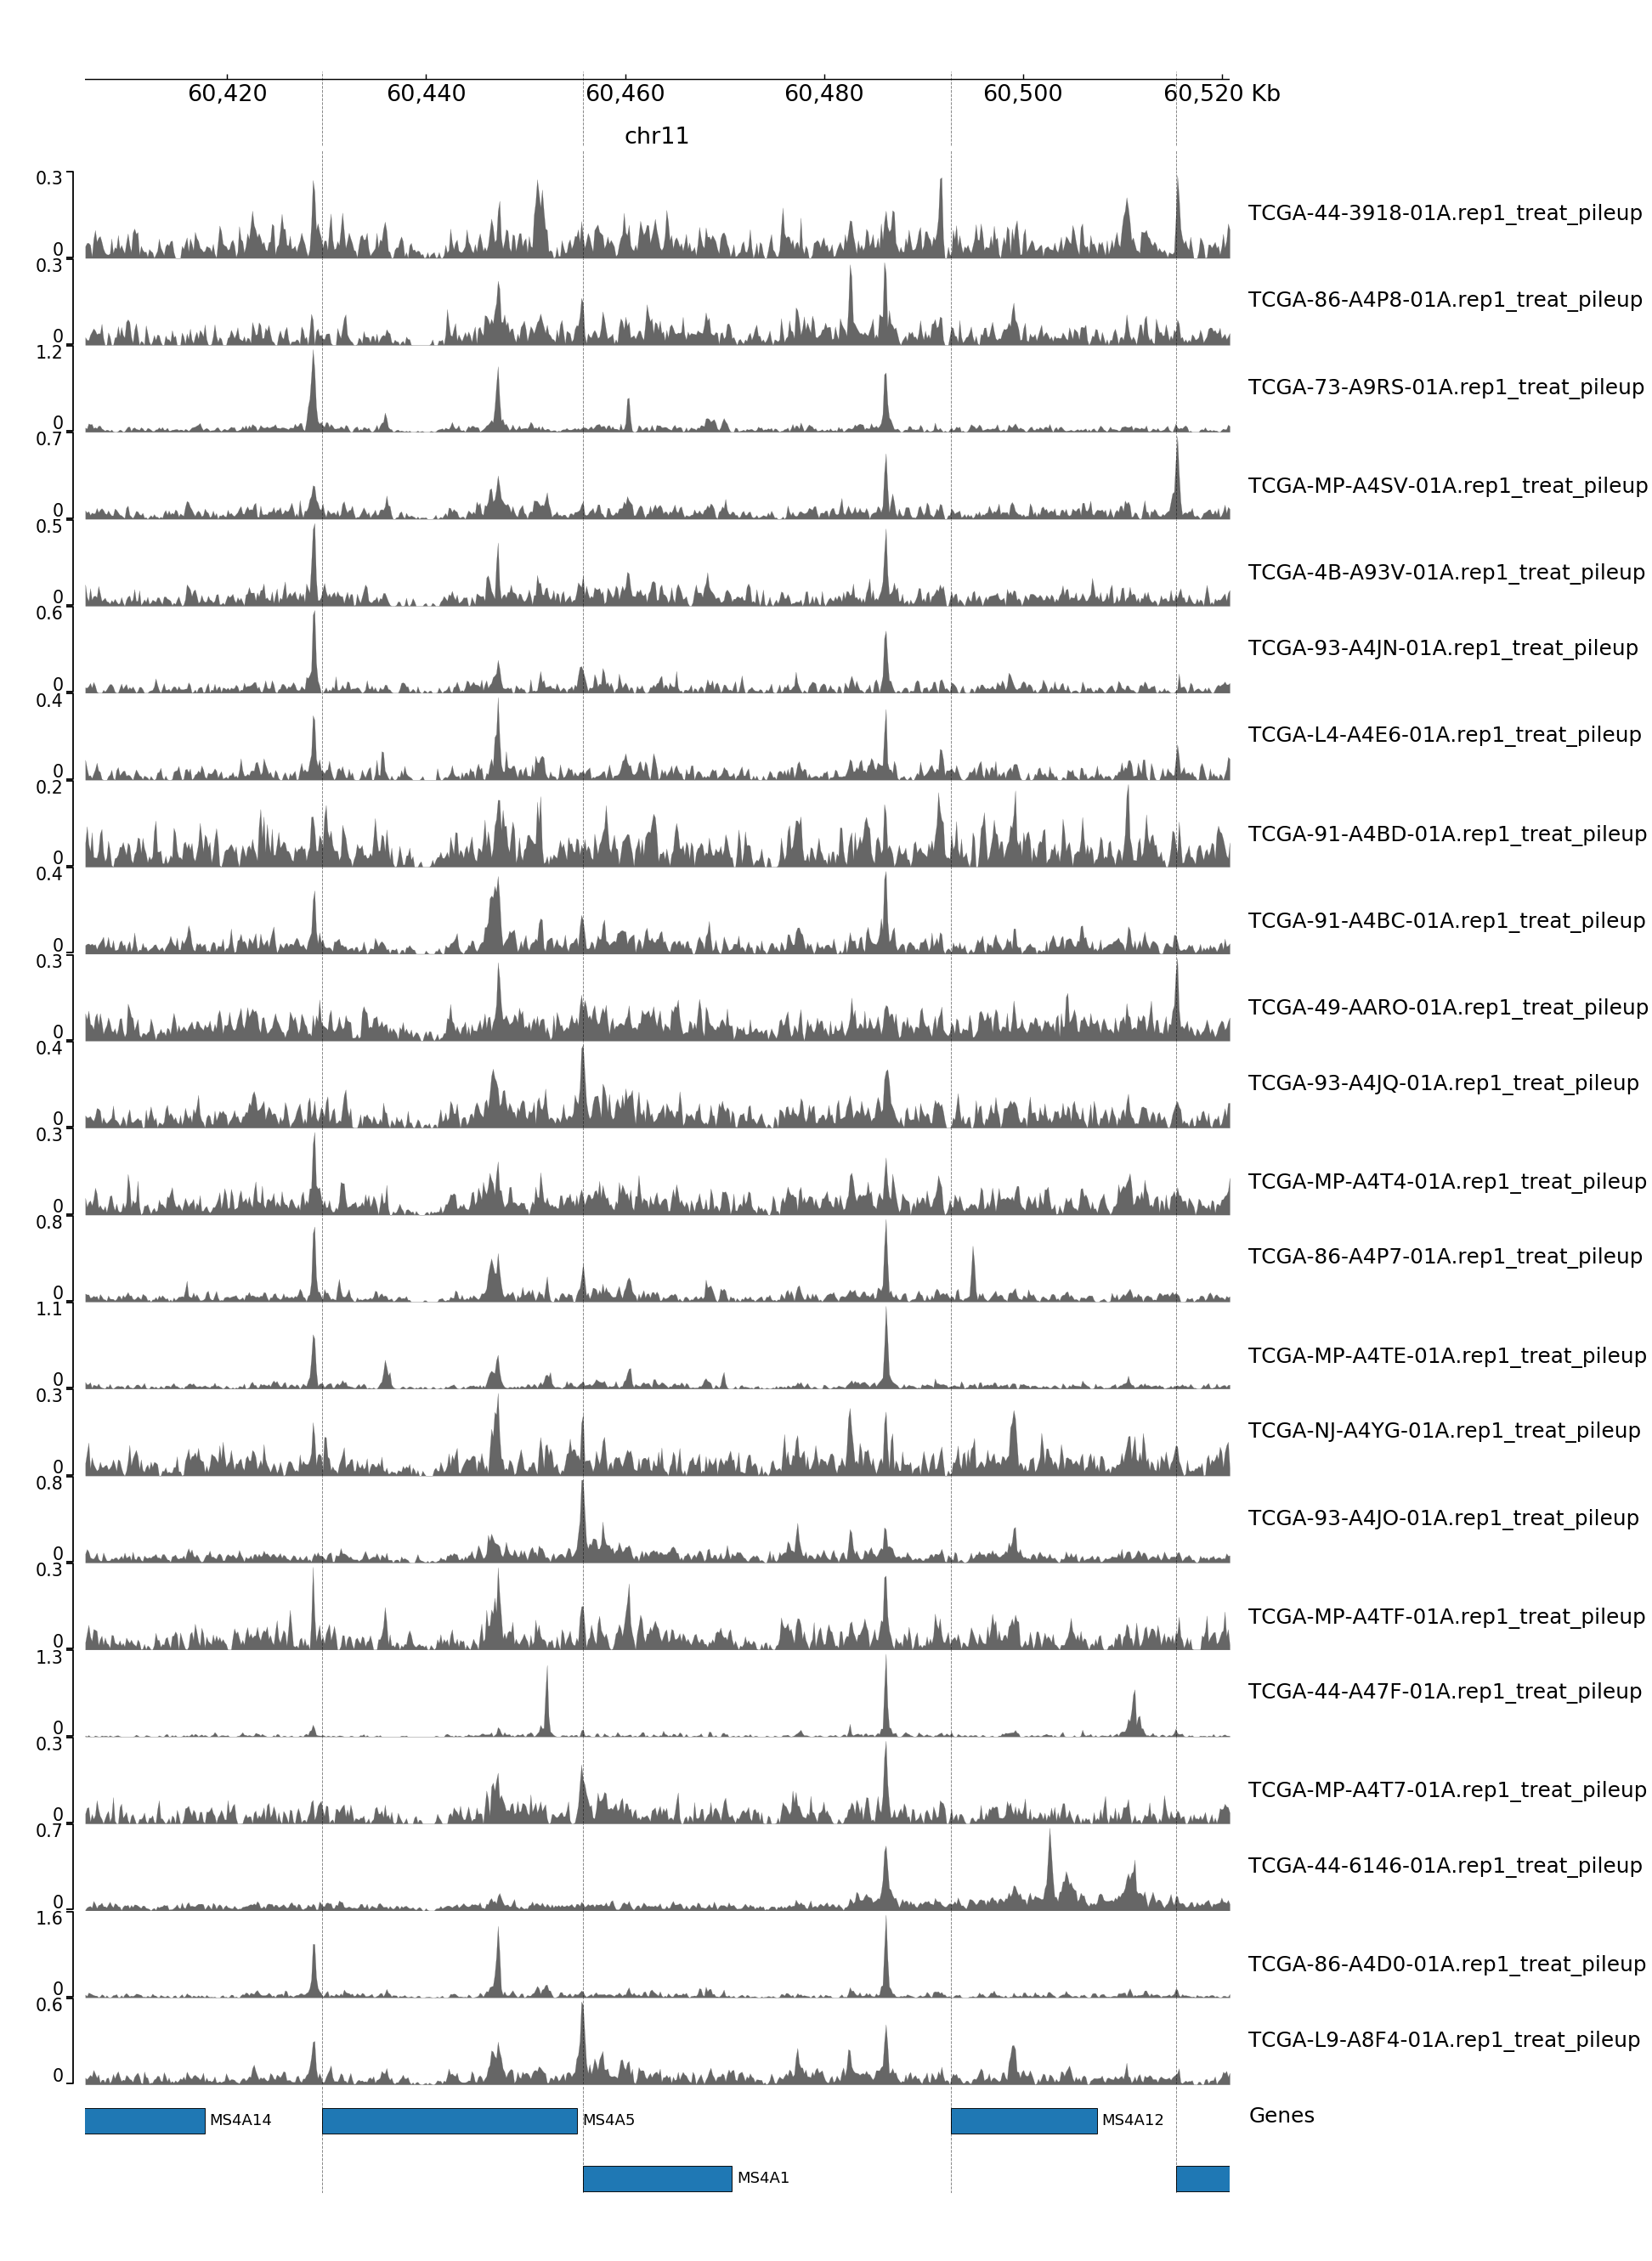
GENOME TRACK FOR MS4A1
The genomic coordinates and chromosome number are indicated above the sample tracks. Transcripts in this region are indicated by the bars below the sample tracks.
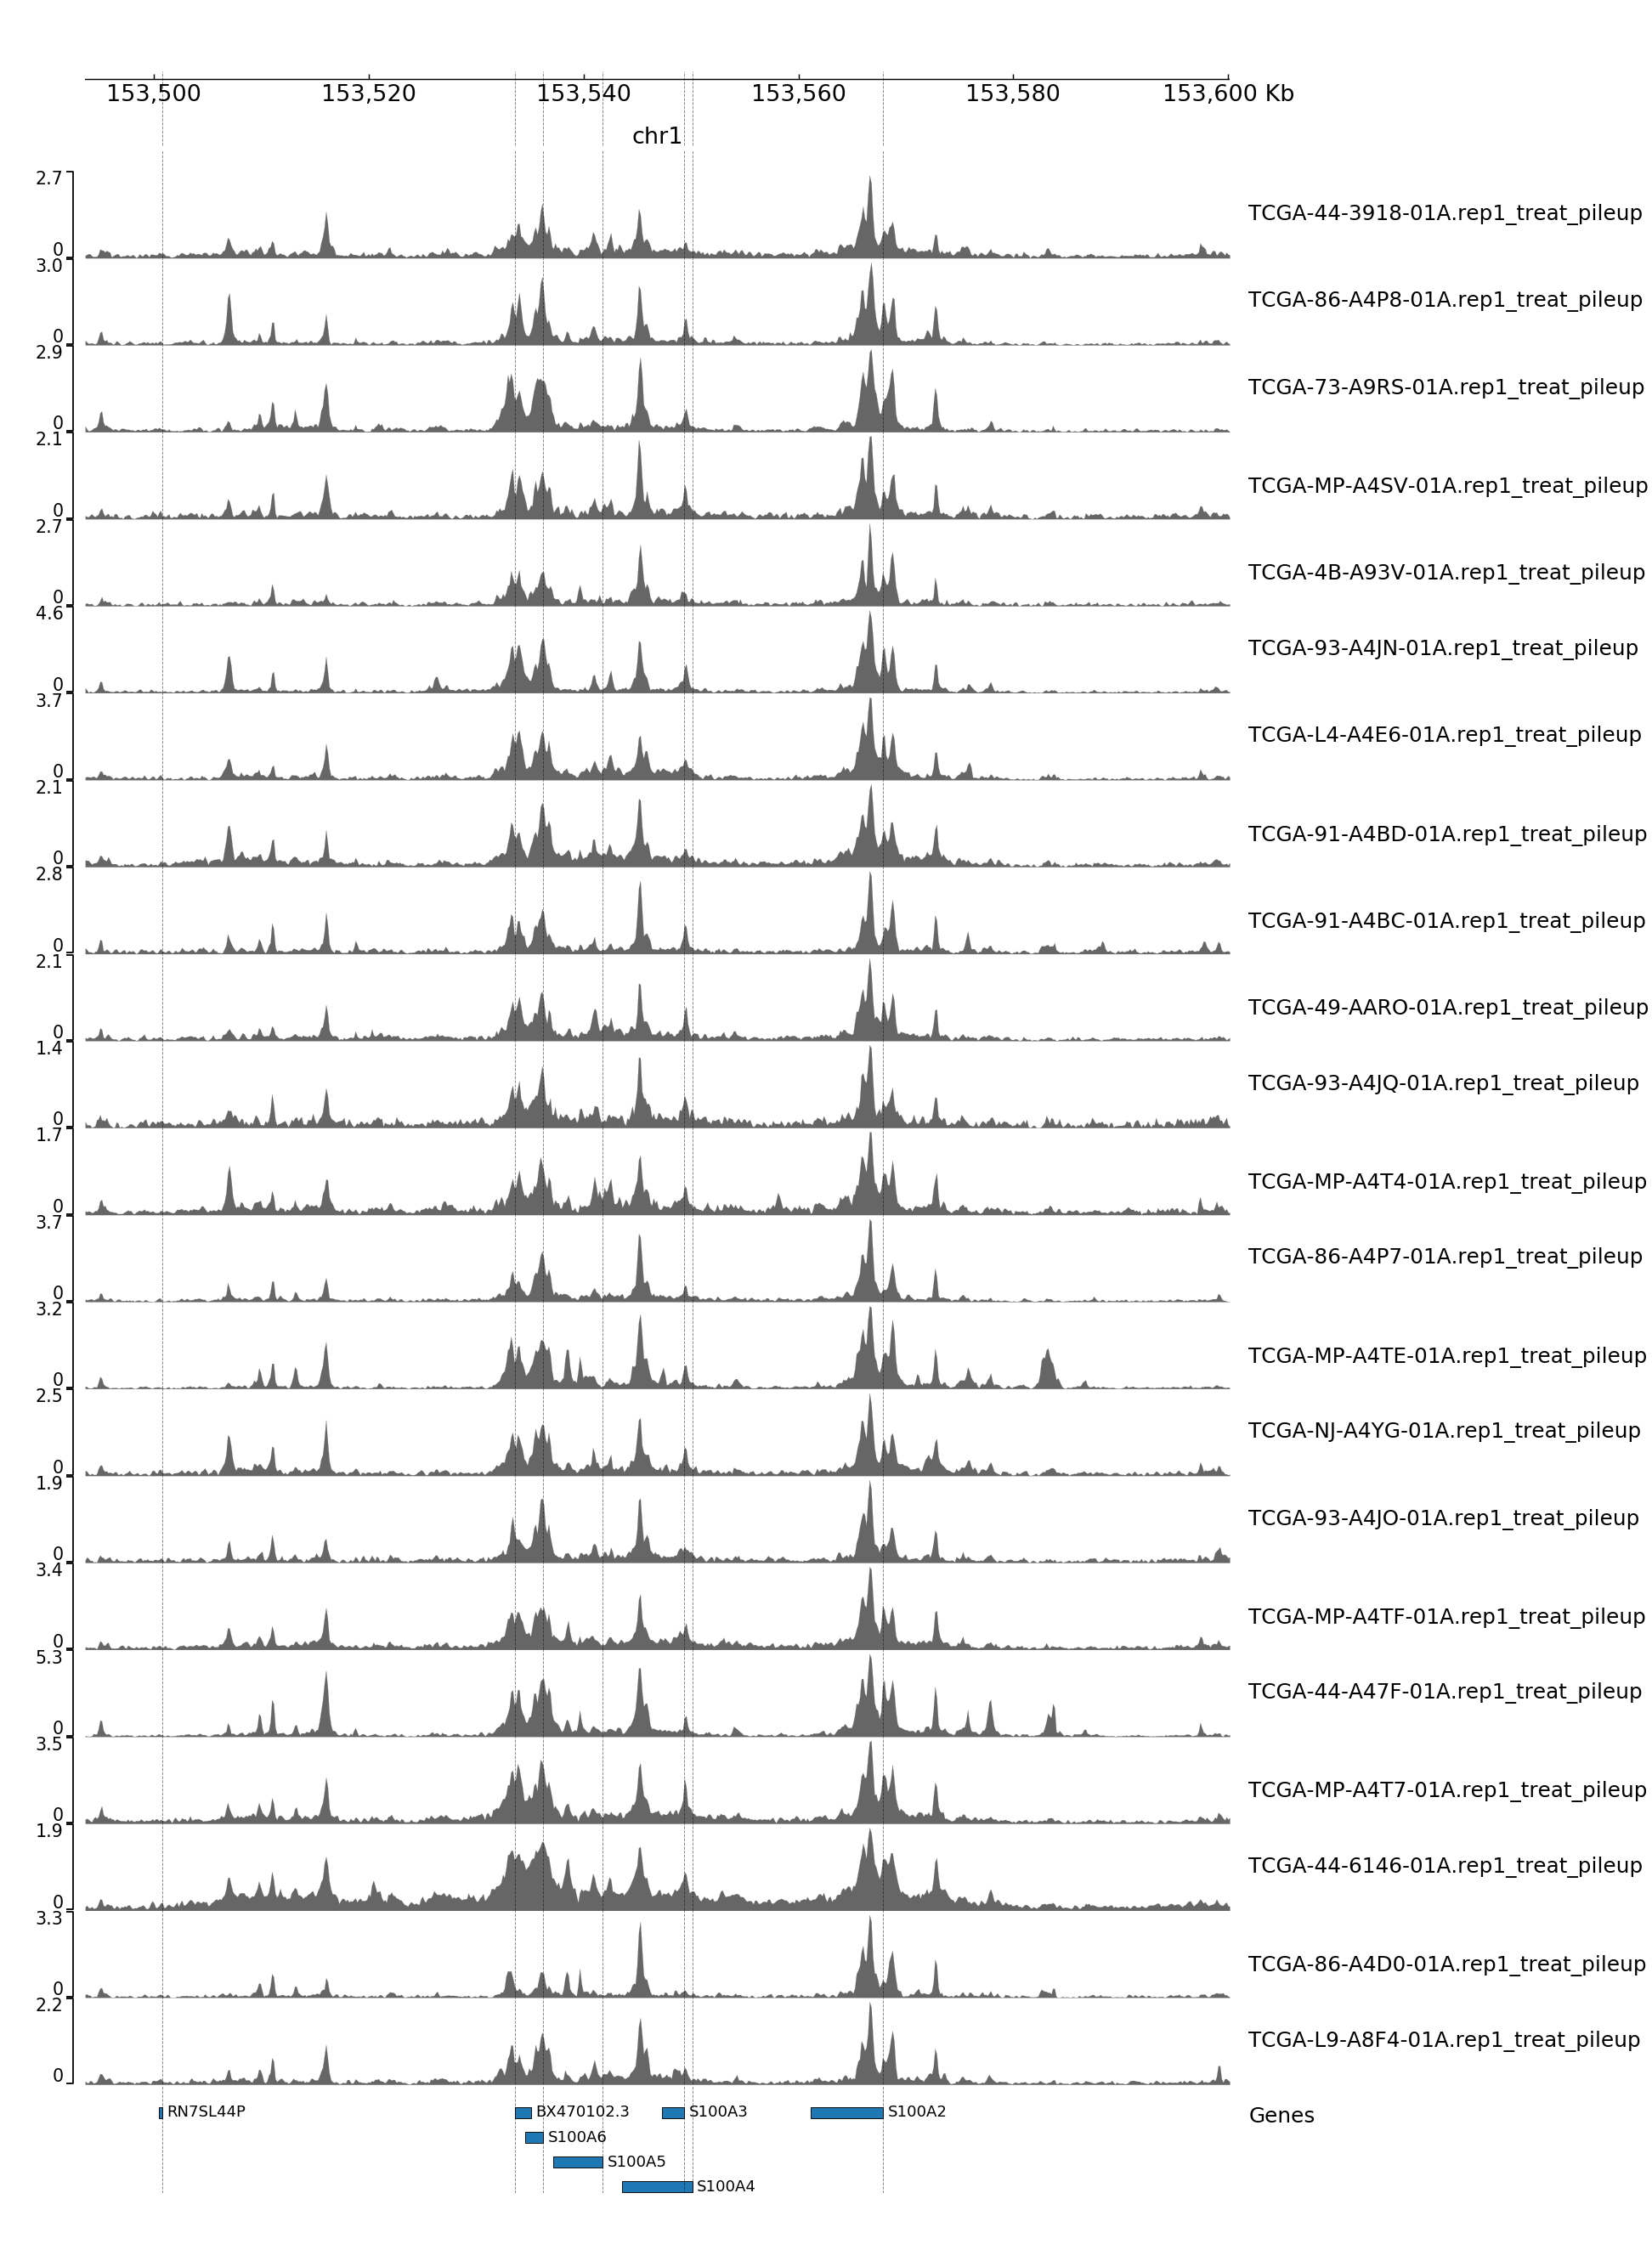
GENOME TRACK FOR S100A4
The genomic coordinates and chromosome number are indicated above the sample tracks. Transcripts in this region are indicated by the bars below the sample tracks.
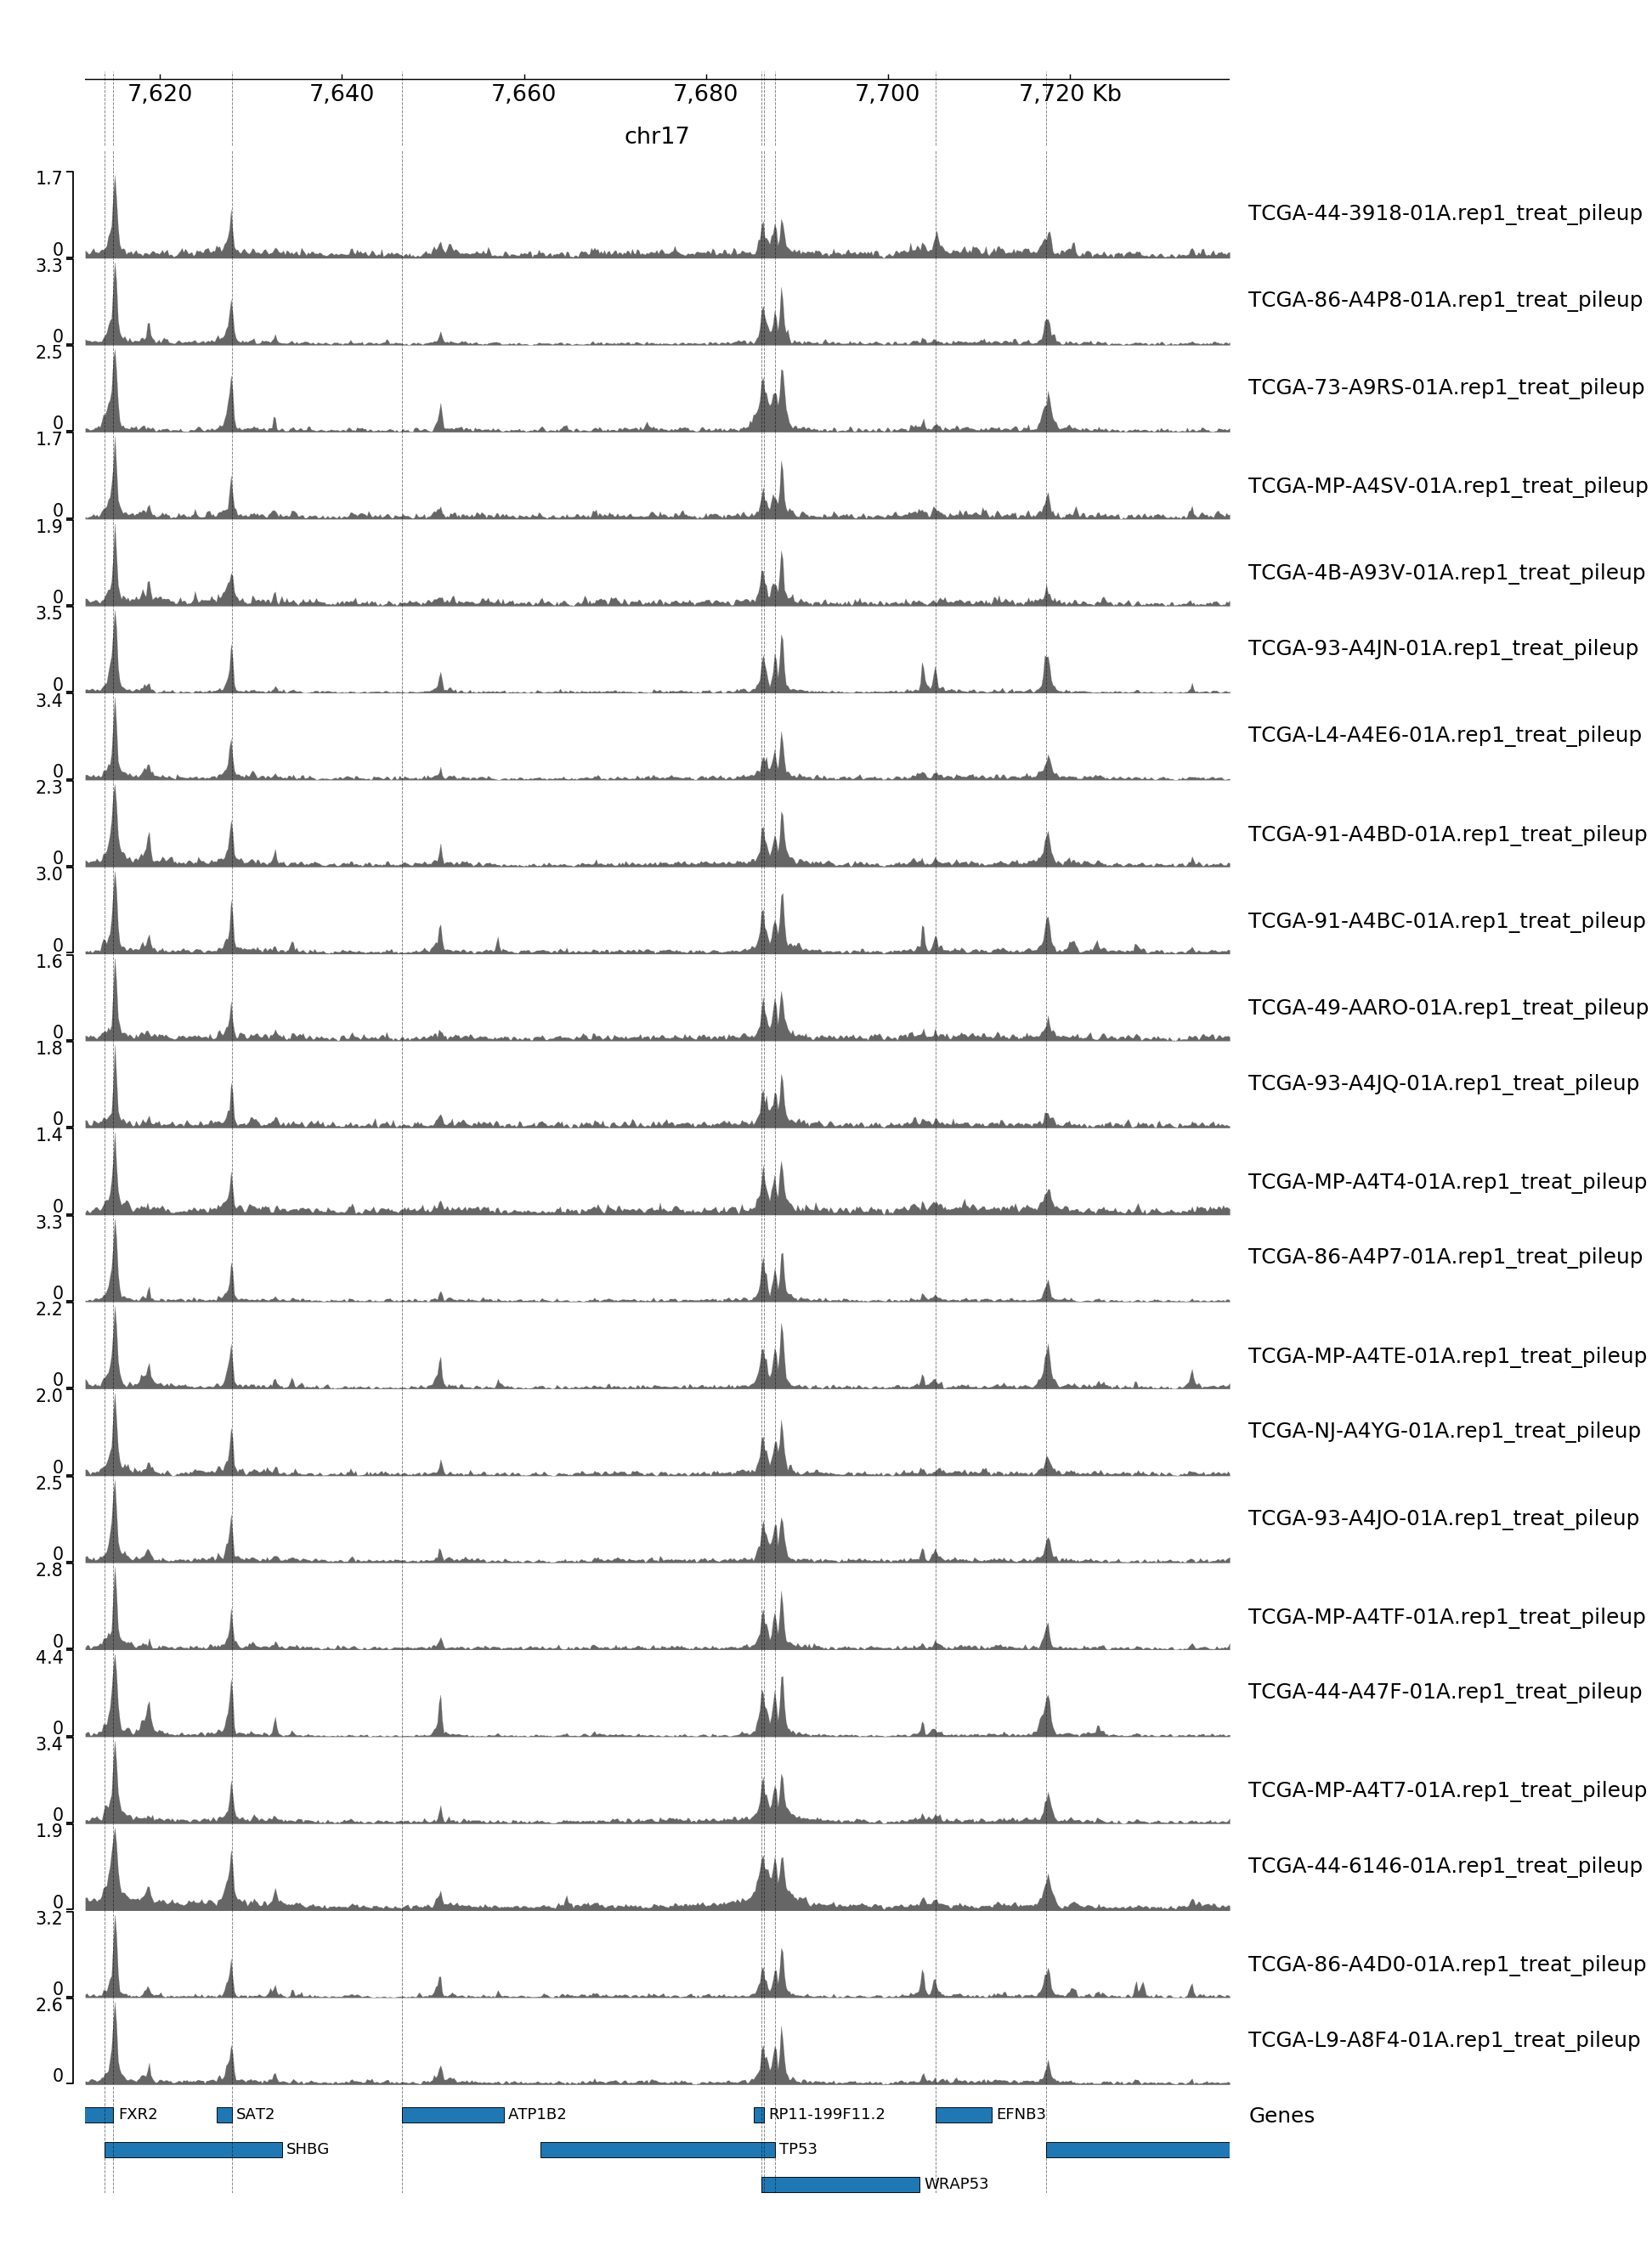
GENOME TRACK FOR TP53
The genomic coordinates and chromosome number are indicated above the sample tracks. Transcripts in this region are indicated by the bars below the sample tracks.
CONSERVATION AND TOP MOTIFS
The conservation plots of transcription factor (ChIP-seq) runs typically show a high focal point around peak summits (characterized as "needle points"), while histone runs typically show bimodal peaks (characterized as "shoulders"). For motif analysis, the top 5000 most significant peak summits (ranked by the MACS P-value) are written to a subfolder for each sample in the report directory. Though several motifs typically arise for each sample, only the top hit is shown here. Further downstream analyses, including regulatory potential scores derived from LISA, are also available for each sample in the report directory.
| Sample | Conservation | Motif | Homer Motif Logo | Negative Log P-value | |
|---|---|---|---|---|---|
| 0 | TCGA-44-3918-01A.rep1 |  |
NFY |  |
698.6 |
| 1 | TCGA-44-6146-01A.rep1 |  |
NFY |  |
562.0 |
| 2 | TCGA-44-A47F-01A.rep1 |  |
Fosl2 |  |
548.4 |
| 3 | TCGA-49-AARO-01A.rep1 |  |
NFY |  |
755.8 |
| 4 | TCGA-4B-A93V-01A.rep1 |  |
NFY |  |
689.9 |
| 5 | TCGA-73-A9RS-01A.rep1 |  |
Sp1 |  |
693.1 |
| 6 | TCGA-86-A4D0-01A.rep1 |  |
NFY |  |
611.9 |
| 7 | TCGA-86-A4P7-01A.rep1 |  |
NFY |  |
872.7 |
| 8 | TCGA-86-A4P8-01A.rep1 |  |
NFY |  |
772.4 |
| 9 | TCGA-91-A4BC-01A.rep1 |  |
NFY |  |
864.1 |
| 10 | TCGA-91-A4BD-01A.rep1 |  |
NFY |  |
637.4 |
| 11 | TCGA-93-A4JN-01A.rep1 |  |
NFY |  |
638.7 |
| 12 | TCGA-93-A4JO-01A.rep1 |  |
Sp1 |  |
851.8 |
| 13 | TCGA-93-A4JQ-01A.rep1 |  |
NFY |  |
919.8 |
| 14 | TCGA-L4-A4E6-01A.rep1 |  |
NFY |  |
725.6 |
| 15 | TCGA-L9-A8F4-01A.rep1 |  |
NFY |  |
865.8 |
| 16 | TCGA-MP-A4SV-01A.rep1 |  |
Sp1 |  |
731.7 |
| 17 | TCGA-MP-A4T4-01A.rep1 |  |
Sp1 |  |
673.2 |
| 18 | TCGA-MP-A4T7-01A.rep1 |  |
NFY |  |
744.1 |
| 19 | TCGA-MP-A4TE-01A.rep1 |  |
Sp1 |  |
661.2 |
| 20 | TCGA-MP-A4TF-01A.rep1 |  |
NFY |  |
760.0 |
| 21 | TCGA-NJ-A4YG-01A.rep1 |  |
NFY |  |
791.3 |