Cistrome Cancer
Cistrome Cancer is a comprehensive resource for predicted transcription factor (TF) targets and enhancer profiles in cancers. The prediction was from integrative analysis of TCGA expression profiles and public ChIP-seq profiles.
Transcription factor targets in cancer
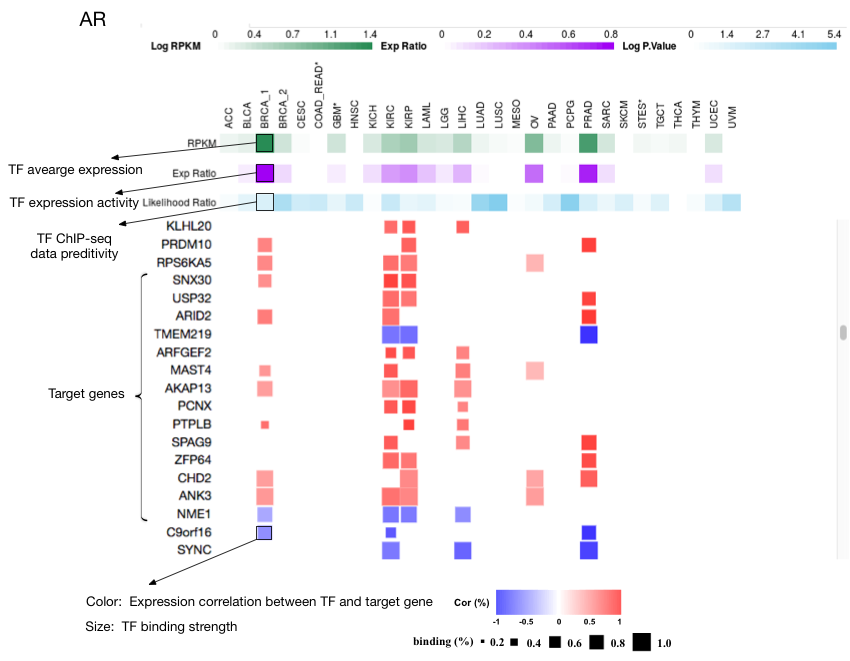
For each transcription factor (TF) expressed in any cancer type, this data resource provides their putative target genes in each cancer type in which the TF is active.
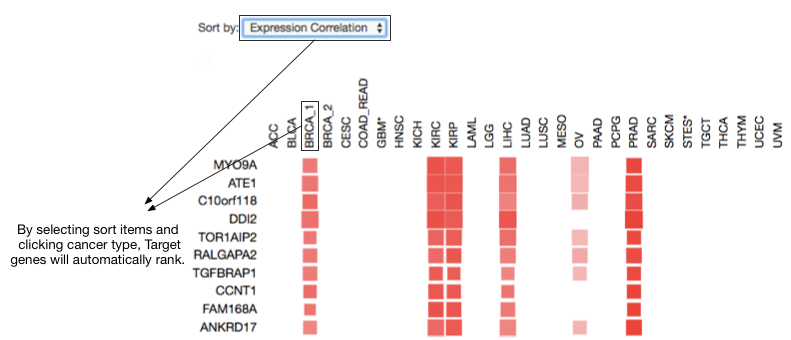
 Ranking target gene by cancer type and selected sorting items.
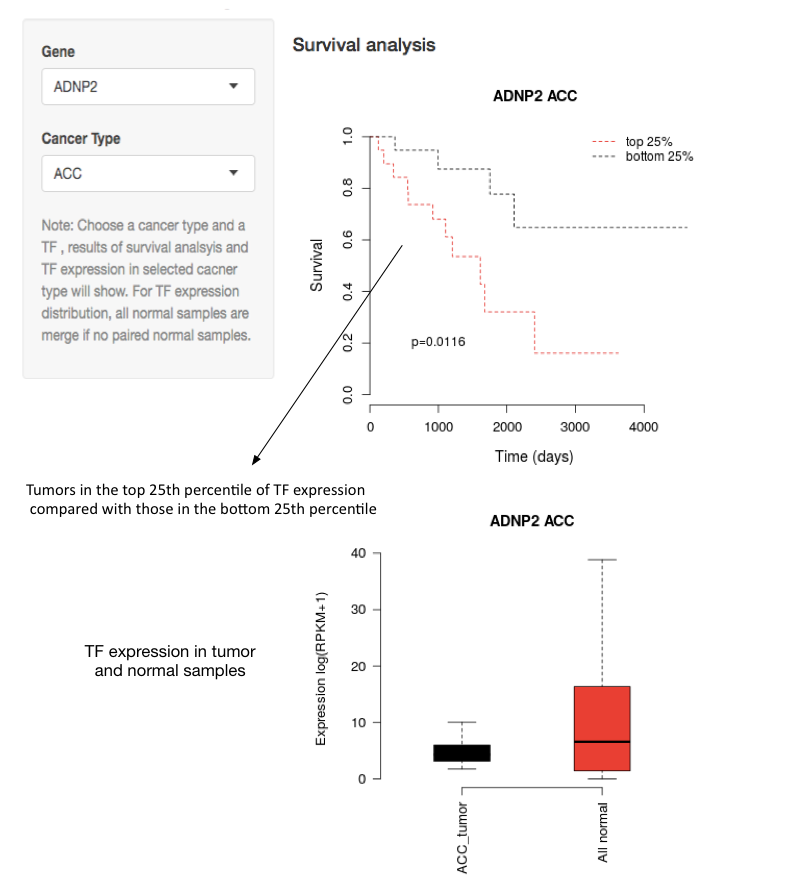
Survival and expression analysis of transcription factor
Given a cancer type and a TF. Survival curves from the top 25% (red) and bottom 25% (black) cancer patients according to TF expression level. P-value was calculated by Kaplain-Meier log-rank test.
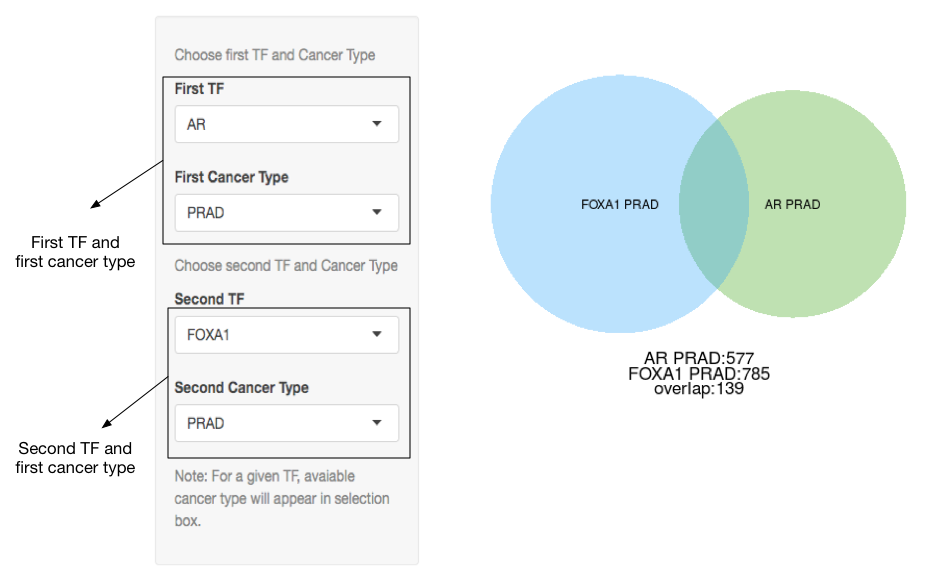
Target gene overlap
A Venn diagram showing the number of shared target genes between two TFs in any two cancer types can be generated.
TCGA cancer type clusters
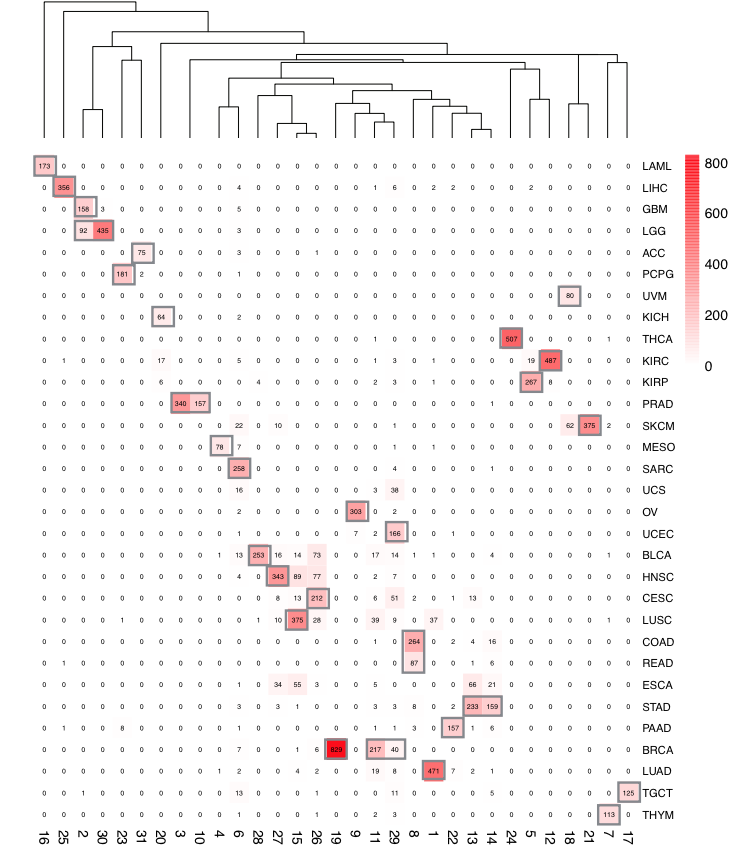
In order to obtain robust and consistent cancer types, over 10 thousand TCGA expression profiles (RNA-seq) from all cancer samples were re-clustered using K-means clustering and 29 cancer clusters were retained. As a result, some unambiguous cancer subtypes were separated as different clusters (e.g. BRCA_1 for basal and BRCA_2 for luminal), while some similar cancer types are merged as one cluster and renamed with the representative cancer type with an asterisk (e.g. COAD and READ as COAD_READ*). Cancer type abbreviations were following the TCGA cancer abbreviations (https://tcga-data.nci.nih.gov/tcga/). For simplicity, we refer to the redefined cancer clusters as “cancer types” thereafter.
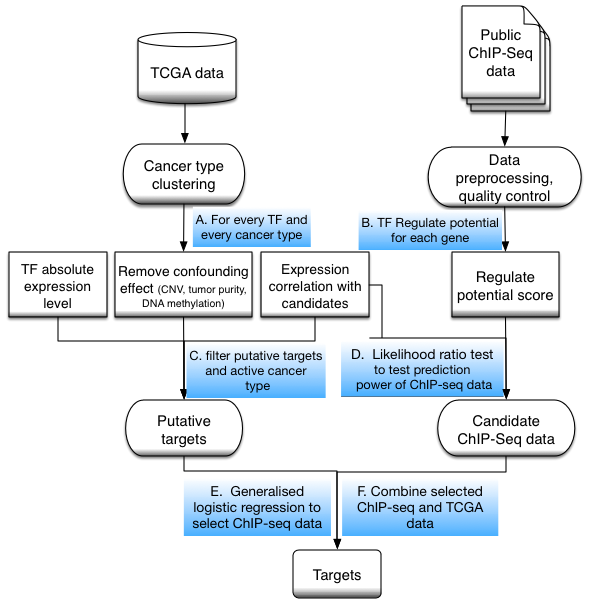
Transcription factor activity and target gene prediction
Target genes for each active TF in each cancer type were predicted from integrative analysis of TCGA molecular profiling data and public TF ChIP-seq data.
1) TF activity: TF activity in each cancer type was assessed by 2 measurements: average expression level (RPKM) and Expression Ratio score. Average expression level (RPKM) was calculated for all tumor samples for each cancer type. The Expression Ratio score of a TF in a cancer type was defined as the fraction of tumor samples in which the TF expression level passes a threshold. The threshold is TF-dependent and defined as the larger value between 1 RPKM (Fig. 2a) and the median expression level of this TF across all tumor samples from all cancer types (Fig. 2b). The Expression Ratio score can reflect the cancer type specificity of TF activities. Target genes were only predicted for active TFs in a cancer type. A TF is active if its Expression Ratio score passes a threshold of 0.25.
2) Candidate target identification by expression correlation: Candidate target genes of each TF in a cancer type were identified as having high expression correlation with the TF across all tumor samples in this cancer type. Using the expression correlations of 1 million randomly selected pairs of genes in a cancer type as a background null distribution, a gene is a candidate target of an active TF if their expression correlation coefficient’s absolute value is ranked top 5% in the null distribution. To eliminate potential confounding effects of CNV, tumor purity, and promoter DNA methylation level on the expression variation across tumor samples, a multiple regression model was constructed for each gene i
Expression(i) ~ Expression(TF), CNV(i), TumorPurityScore(i), DNAme(i)
And genes with significant regression coefficient (under a p-value threshold of 0.01) against the TF expression were further selected as candidate target genes.
3) Target predictability of TF ChIP-seq data: The RP scores on all genes for each ChIP-seq dataset were used to generate a prediction model of the candidate target genes. In order to evaluate whether the TF ChIP-seq data is predictive of candidate target genes, a likelihood ratio test between prediction models using TF ChIP-seq and chromatin input sequencing data and prediction models using only chromatin input sequencing data was performed. 500 chromatin input sequencing datasets were collected in different cell types for the test. The likelihood ratio score is also reported to reflect the prediction power of the TF ChIP-seq data.
4) Target gene identification. Putative target genes of a TF were predicted as both showing high expression correlation and being supported by ChIP-seq derived TF binding information. Using candidate target genes with high expression correlation and RP scores from TF ChIP-seq data, a generalized multiple regression model was used to select informative ChIP-seq datasets. After at most 10 informative ChIP-seq datasets were selected in the model, adjusted RP scores were generated by linear combination using regression coefficients. The final target genes were identified as passing a threshold on the adjusted RP score. The threshold was determined as maximizing the Youden index (sensitivity+specificity−1). The final target gene list was ranked by the rank product between expression correlation and adjusted RP score by default, with the expression correlation and the adjusted RP score percentile represented as the color density and the size of the square, respectively.